
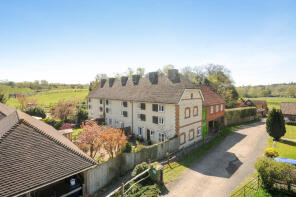
House Prices in Runfold
House prices in Runfold have an overall average of £182,000 over the last year.
Overall, the historical sold prices in Runfold over the last year were 61% down on the previous year and 85% down on the 2008 peak of £1,250,000.
Properties Sold
Flat 9, Sandhurst, Guildford Road, Runfold, Farnham GU10 1PG
| Today | See what it's worth now |
| 9 Jan 2026 | £205,000 |
| 11 Nov 2014 | £146,000 |
Flat 5, Sandhurst, Guildford Road, Runfold, Farnham GU10 1PG
| Today | See what it's worth now |
| 25 Jul 2025 | £159,000 |
| 6 Jan 2012 | £125,000 |
1, Glen Cottages, Guildford Road, Runfold, Farnham GU10 1PF
| Today | See what it's worth now |
| 7 Mar 2025 | £440,000 |
| 26 Mar 2021 | £440,000 |
Flat 8, Sandhurst, Guildford Road, Runfold, Farnham GU10 1PG

| Today | See what it's worth now |
| 7 Nov 2024 | £170,000 |
| 29 Mar 2016 | £174,950 |
Flat 2, Hillcrest, Guildford Road, Runfold, Farnham GU10 1NZ
| Today | See what it's worth now |
| 4 Nov 2024 | £385,000 |
| 26 May 2022 | £370,650 |
Flat 6, Sandhurst, Guildford Road, Runfold, Farnham GU10 1PG
| Today | See what it's worth now |
| 14 Oct 2024 | £165,000 |
| 12 Feb 2015 | £155,000 |
5, The Kilns, Rock House Lane, Runfold, Farnham GU10 1NP
| Today | See what it's worth now |
| 9 Sep 2024 | £1,150,000 |
| 22 Sep 1998 | £338,820 |
No other historical records.
Flat 3, Sandhurst, Guildford Road, Runfold, Farnham GU10 1PG

| Today | See what it's worth now |
| 18 Apr 2024 | £162,000 |
| 20 Sep 1999 | £75,000 |
No other historical records.
12, Crooksbury Road, Farnham GU10 1QE
| Today | See what it's worth now |
| 22 Mar 2024 | £895,000 |
| 15 Dec 2005 | £478,000 |
No other historical records.
6 Hendrick House, Crooksbury Road, Farnham GU10 1QE
| Today | See what it's worth now |
| 2 Nov 2023 | £1,350,000 |
| 11 Jun 2021 | £650,000 |
No other historical records.
9 Pippins, Tongham Road, Runfold, Farnham GU10 1PH
| Today | See what it's worth now |
| 28 Sep 2023 | £960,000 |
| 10 Oct 2002 | £385,000 |
No other historical records.
2, Oak Tree View, Runfold St George, Badshot Lea, Farnham GU10 1PP

| Today | See what it's worth now |
| 7 Jul 2023 | £802,000 |
No other historical records.
36 Wagtails, Crooksbury Road, Farnham GU10 1QE
| Today | See what it's worth now |
| 30 Jun 2023 | £1,840,000 |
| 7 Jun 2021 | £1,825,000 |
No other historical records.
1, The Kilns, Rock House Lane, Runfold, Farnham GU10 1NP
| Today | See what it's worth now |
| 10 Nov 2022 | £680,000 |
| 1 Jun 2021 | £680,000 |
No other historical records.
3 Thumblands Cottage, Sands Road, Sands, Farnham GU10 1PX

| Today | See what it's worth now |
| 30 Sep 2022 | £1,095,650 |
No other historical records.
Flat 4, Sandhurst, Guildford Road, Runfold, Farnham GU10 1PG

| Today | See what it's worth now |
| 14 Jan 2022 | £205,000 |
| 5 Oct 2015 | £175,000 |
2, Glen Cottages, Guildford Road, Runfold, Farnham GU10 1PF

| Today | See what it's worth now |
| 30 Sep 2021 | £460,000 |
| 17 Jun 2015 | £450,000 |
8 Briars, Crooksbury Road, Farnham GU10 1QE
| Today | See what it's worth now |
| 25 Aug 2021 | £818,000 |
| 22 Aug 2002 | £390,000 |
Highfield Heights Farm, Guildford Road, Runfold, Farnham GU10 1PN
| Today | See what it's worth now |
| 30 Jun 2021 | £400,000 |
No other historical records.
Wey Cottage, Moor Park Lane, Farnham GU10 1NS

| Today | See what it's worth now |
| 28 May 2021 | £925,000 |
| 8 Jun 2018 | £615,000 |
9, Crooksbury Road, Farnham GU10 1QE
| Today | See what it's worth now |
| 23 Apr 2021 | £830,000 |
| 28 Feb 2001 | £300,000 |
11 Condor, Tongham Road, Runfold, Farnham GU10 1PH
| Today | See what it's worth now |
| 8 Apr 2021 | £480,000 |
| 14 Jun 1996 | £68,000 |
No other historical records.
Hewitts Farmhouse, Tongham Road, Runfold, Farnham GU10 1PJ

| Today | See what it's worth now |
| 4 Mar 2021 | £1,450,000 |
| 28 Apr 2014 | £750,000 |
No other historical records.
Source Acknowledgement: © Crown copyright. England and Wales house price data is publicly available information produced by the HM Land Registry.This material was last updated on 9 July 2026. It covers the period from 1 January 1995 to 30 April 2026 and contains property transactions which have been registered during that period. Contains HM Land Registry data © Crown copyright and database right 2026. This data is licensed under the Open Government Licence v3.0.
Disclaimer: Rightmove.co.uk provides this HM Land Registry data "as is". The burden for fitness of the data relies completely with the user and is provided for informational purposes only. No warranty, express or implied, is given relating to the accuracy of content of the HM Land Registry data and Rightmove does not accept any liability for error or omission. If you have found an error with the data or need further information please contact HM Land Registry.
Permitted Use: Viewers of this Information are granted permission to access this Crown copyright material and to download it onto electronic, magnetic, optical or similar storage media provided that such activities are for private research, study or in-house use only. Any other use of the material requires the formal written permission of Land Registry which can be requested from us, and is subject to an additional licence and associated charge.
Rightmove takes no liability for your use of, or reliance on, Rightmove's Instant Valuation due to the limitations of our tracking tool listed here. Use of this tool is taken entirely at your own risk. All rights reserved.