
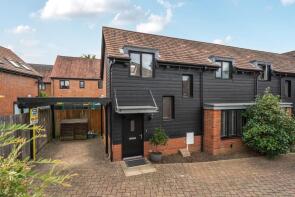
House Prices in Ryarsh
House prices in Ryarsh have an overall average of £420,781 over the last year.
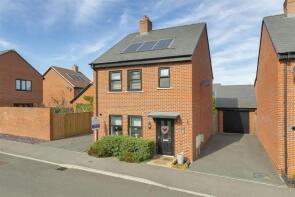
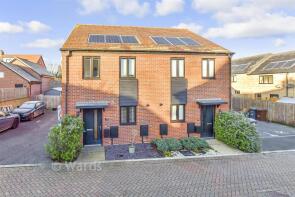
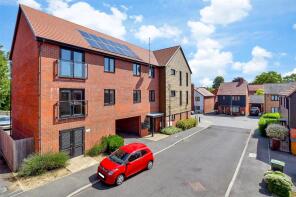
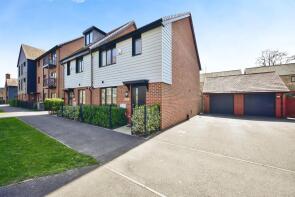
The majority of properties sold in Ryarsh during the last year were flats, selling for an average price of £220,700. Semi-detached properties sold for an average of £411,444, with detached properties fetching £731,714.
Overall, the historical sold prices in Ryarsh over the last year were 3% down on the previous year and 1% down on the 2007 peak of £426,101.
Properties Sold
30, Hilder Street, Leybourne, West Malling ME19 5SR
| Today | See what it's worth now |
| 13 Apr 2026 | £472,500 |
| 1 Mar 2018 | £398,000 |
No other historical records.
1, Rose Avenue, Leybourne, West Malling ME19 5GY
| Today | See what it's worth now |
| 27 Mar 2026 | £350,000 |
| 25 Jun 2021 | £325,000 |
Flat 3, 2, Rowan Street, Leybourne, West Malling ME19 5SN
| Today | See what it's worth now |
| 26 Mar 2026 | £221,000 |
| 31 Oct 2018 | £192,950 |
No other historical records.
21, Bannister Way, Leybourne, West Malling ME19 5GQ
| Today | See what it's worth now |
| 13 Mar 2026 | £470,000 |
| 7 May 2021 | £385,000 |
31, Derby Drive, Leybourne, West Malling ME19 5FJ
| Today | See what it's worth now |
| 20 Feb 2026 | £321,000 |
| 8 Oct 2020 | £289,995 |
Haere Mai, London Road, Ryarsh, West Malling ME19 5AJ
| Today | See what it's worth now |
| 12 Feb 2026 | £515,000 |
| 24 Jul 2003 | £235,000 |
No other historical records.
Flat 8, 2, Rowan Street, Leybourne, West Malling ME19 5SN

| Today | See what it's worth now |
| 31 Jan 2026 | £225,000 |
| 3 Oct 2018 | £194,650 |
No other historical records.
1, Hirschield Drive, Leybourne, West Malling ME19 5GN
| Today | See what it's worth now |
| 8 Jan 2026 | £365,000 |
| 4 Aug 2017 | £299,995 |
No other historical records.
50, Hawley Drive, Leybourne, West Malling ME19 5FE
| Today | See what it's worth now |
| 8 Jan 2026 | £355,000 |
| 15 Nov 2019 | £312,000 |
20, Derby Drive, Leybourne, West Malling ME19 5FJ
| Today | See what it's worth now |
| 19 Dec 2025 | £337,500 |
| 11 Mar 2016 | £273,500 |
24, Bluegown Avenue, Leybourne, West Malling ME19 5FN
| Today | See what it's worth now |
| 12 Dec 2025 | £430,000 |
| 25 Apr 2014 | £295,000 |
No other historical records.
91, Chapel Street, Ryarsh, West Malling ME19 5LW
| Today | See what it's worth now |
| 4 Dec 2025 | £462,000 |
| 16 Dec 2014 | £332,560 |
3, Brooks Drive, Ryarsh, West Malling ME19 5GS

| Today | See what it's worth now |
| 28 Nov 2025 | £485,000 |
| 18 Nov 2016 | £459,995 |
No other historical records.
2, Hawthorn Grove, Leybourne, West Malling ME19 5SG

| Today | See what it's worth now |
| 18 Nov 2025 | £600,000 |
| 19 Dec 2017 | £475,000 |
No other historical records.
Flat 9, 28, Bannister Way, Leybourne, West Malling ME19 5SA
| Today | See what it's worth now |
| 14 Nov 2025 | £245,000 |
| 22 Nov 2018 | £243,000 |
No other historical records.
13, Derby Drive, Leybourne, West Malling ME19 5FJ
| Today | See what it's worth now |
| 7 Nov 2025 | £360,000 |
| 25 Nov 2021 | £350,000 |
5, Clacketts Farm, Ryarsh Road, Birling, West Malling ME19 5JR

| Today | See what it's worth now |
| 4 Nov 2025 | £510,000 |
| 3 Apr 2014 | £340,500 |
Beech House, London Road, Ryarsh, West Malling ME19 5AJ
| Today | See what it's worth now |
| 31 Oct 2025 | £475,000 |
| 28 Apr 2023 | £437,500 |
Flat 6, 96, Hawley Drive, Leybourne, West Malling ME19 5FL
| Today | See what it's worth now |
| 29 Oct 2025 | £240,000 |
| 4 Nov 2022 | £265,000 |
No other historical records.
Flat 4, 6, Wills Crescent, Leybourne, West Malling ME19 5GJ

| Today | See what it's worth now |
| 24 Oct 2025 | £220,000 |
| 14 Mar 2023 | £220,000 |
Dormy House, East Street, Addington, West Malling ME19 5DE
| Today | See what it's worth now |
| 23 Oct 2025 | £700,000 |
| 26 Jun 1996 | £130,000 |
No other historical records.
Flat 4, 36, Derby Drive, Leybourne, West Malling ME19 5FJ
| Today | See what it's worth now |
| 30 Sep 2025 | £96,000 |
| 31 Jan 2019 | £80,000 |
No other historical records.
17, Orpin Avenue, Leybourne, West Malling ME19 5FS
| Today | See what it's worth now |
| 19 Sep 2025 | £348,000 |
| 23 Sep 2016 | £310,000 |
No other historical records.
Source Acknowledgement: © Crown copyright. England and Wales house price data is publicly available information produced by the HM Land Registry.This material was last updated on 9 July 2026. It covers the period from 1 January 1995 to 30 April 2026 and contains property transactions which have been registered during that period. Contains HM Land Registry data © Crown copyright and database right 2026. This data is licensed under the Open Government Licence v3.0.
Disclaimer: Rightmove.co.uk provides this HM Land Registry data "as is". The burden for fitness of the data relies completely with the user and is provided for informational purposes only. No warranty, express or implied, is given relating to the accuracy of content of the HM Land Registry data and Rightmove does not accept any liability for error or omission. If you have found an error with the data or need further information please contact HM Land Registry.
Permitted Use: Viewers of this Information are granted permission to access this Crown copyright material and to download it onto electronic, magnetic, optical or similar storage media provided that such activities are for private research, study or in-house use only. Any other use of the material requires the formal written permission of Land Registry which can be requested from us, and is subject to an additional licence and associated charge.
Rightmove takes no liability for your use of, or reliance on, Rightmove's Instant Valuation due to the limitations of our tracking tool listed here. Use of this tool is taken entirely at your own risk. All rights reserved.