
House Prices in Saltney
House prices in Saltney have an overall average of £206,795 over the last year.
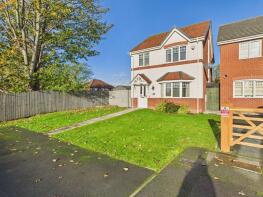
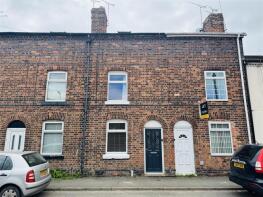
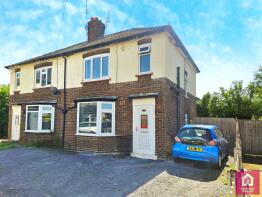
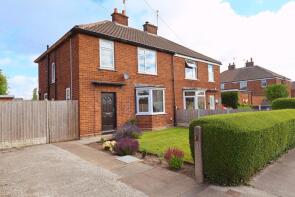
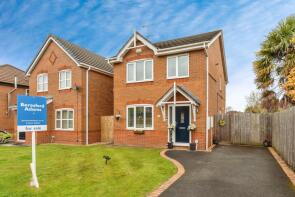
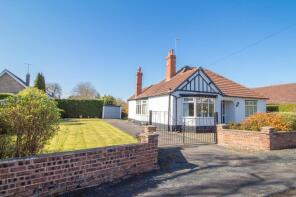
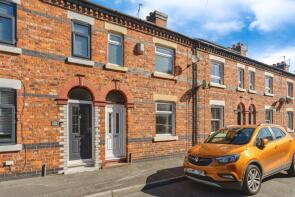
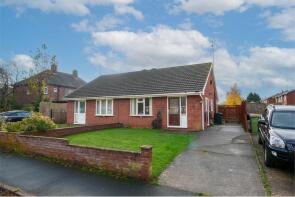
The majority of properties sold in Saltney during the last year were semi-detached properties, selling for an average price of £188,478. Detached properties sold for an average of £328,846, with terraced properties fetching £188,136.
Overall, the historical sold prices in Saltney over the last year were 3% down on the previous year and similar to the 2022 peak of £205,560.
Properties Sold
Mill House, Poppy Field Park, Chester CH4 8FF
| Today | See what it's worth now |
| 1 Apr 2026 | £269,000 |
| 21 Nov 2018 | £198,995 |
No other historical records.
7, Ty Caernarfon, Cwrt Y Terfyn, Chester CH4 8QT

| Today | See what it's worth now |
| 31 Mar 2026 | £90,000 |
| 16 Jun 2016 | £105,000 |
15, Boundary Lane, Chester CH4 8LN
| Today | See what it's worth now |
| 27 Mar 2026 | £155,000 |
| 24 Feb 2021 | £134,000 |
13, Belgrave Avenue, Chester CH4 8TY
| Today | See what it's worth now |
| 12 Mar 2026 | £168,000 |
| 28 Feb 2020 | £115,000 |
No other historical records.
11, Ty Bala, Cwrt Y Terfyn, Chester CH4 8QL

| Today | See what it's worth now |
| 6 Mar 2026 | £140,000 |
| 10 Mar 2010 | £129,950 |
No other historical records.
15, Belmont Drive, Chester CH4 0AL
| Today | See what it's worth now |
| 2 Mar 2026 | £165,000 |
| 7 Oct 2002 | £23,650 |
No other historical records.
Apartment 5, 173, High Street, Chester CH4 8SJ
| Today | See what it's worth now |
| 27 Feb 2026 | £88,000 |
| 14 Mar 2008 | £93,500 |
No other historical records.
4, Tatton Close, Chester CH4 8PW
| Today | See what it's worth now |
| 25 Feb 2026 | £230,000 |
| 25 Feb 2026 | £230,000 |
65, Park Avenue, Saltney CH4 8TR
| Today | See what it's worth now |
| 24 Feb 2026 | £170,000 |
No other historical records.
132, Victoria Road, Chester CH4 8SZ

| Today | See what it's worth now |
| 19 Feb 2026 | £220,000 |
| 29 Jan 2007 | £110,000 |
No other historical records.
5, Aled Way, Chester CH4 8UP
| Today | See what it's worth now |
| 16 Feb 2026 | £270,000 |
| 30 Jul 2020 | £230,000 |
72, Woodall Avenue, Chester CH4 8LR
| Today | See what it's worth now |
| 13 Feb 2026 | £178,000 |
| 25 Jan 2006 | £133,500 |
65, Boundary Lane, Chester CH4 8PL
| Today | See what it's worth now |
| 30 Jan 2026 | £195,000 |
| 12 Aug 2002 | £74,950 |
1, Sunbury Crescent, Chester CH4 8EE
| Today | See what it's worth now |
| 16 Jan 2026 | £240,000 |
| 8 Feb 2024 | £225,000 |
4, The Hamlet, Chester CH4 8JW

| Today | See what it's worth now |
| 16 Jan 2026 | £699,000 |
No other historical records.
5, Sheringham Close, Chester CH4 8PN
| Today | See what it's worth now |
| 8 Jan 2026 | £225,000 |
| 15 Jun 2011 | £129,950 |
3, Conway Close, Chester CH4 8UJ
| Today | See what it's worth now |
| 19 Dec 2025 | £257,500 |
| 31 Oct 2022 | £224,000 |
115, St Marks Road, Chester CH4 8DF
| Today | See what it's worth now |
| 18 Dec 2025 | £260,000 |
| 28 Nov 2003 | £94,000 |
No other historical records.
31, Stanley Park Drive, Chester CH4 8PQ
| Today | See what it's worth now |
| 17 Dec 2025 | £255,500 |
| 1 Feb 2019 | £193,000 |
11, Woodlands Road, Chester CH4 8LB
| Today | See what it's worth now |
| 17 Dec 2025 | £435,000 |
No other historical records.
31, North Street, Chester CH4 0BH
| Today | See what it's worth now |
| 16 Dec 2025 | £155,000 |
| 24 Apr 2015 | £70,000 |
No other historical records.
8, Chain Makers Row, Chester CH4 8QZ
| Today | See what it's worth now |
| 16 Dec 2025 | £175,000 |
| 3 Oct 1997 | £54,950 |
No other historical records.
3, Mercer Way, Chester CH4 8DB
| Today | See what it's worth now |
| 15 Dec 2025 | £167,500 |
| 3 Jan 2001 | £55,000 |
No other historical records.

Source Acknowledgement: © Crown copyright. England and Wales house price data is publicly available information produced by the HM Land Registry.This material was last updated on 9 July 2026. It covers the period from 1 January 1995 to 30 April 2026 and contains property transactions which have been registered during that period. Contains HM Land Registry data © Crown copyright and database right 2026. This data is licensed under the Open Government Licence v3.0.
Disclaimer: Rightmove.co.uk provides this HM Land Registry data "as is". The burden for fitness of the data relies completely with the user and is provided for informational purposes only. No warranty, express or implied, is given relating to the accuracy of content of the HM Land Registry data and Rightmove does not accept any liability for error or omission. If you have found an error with the data or need further information please contact HM Land Registry.
Permitted Use: Viewers of this Information are granted permission to access this Crown copyright material and to download it onto electronic, magnetic, optical or similar storage media provided that such activities are for private research, study or in-house use only. Any other use of the material requires the formal written permission of Land Registry which can be requested from us, and is subject to an additional licence and associated charge.
Rightmove takes no liability for your use of, or reliance on, Rightmove's Instant Valuation due to the limitations of our tracking tool listed here. Use of this tool is taken entirely at your own risk. All rights reserved.