
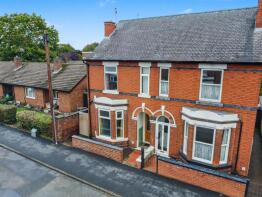
House Prices in Sandiacre
House prices in Sandiacre have an overall average of £245,107 over the last year.
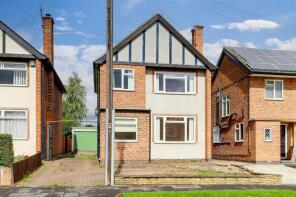
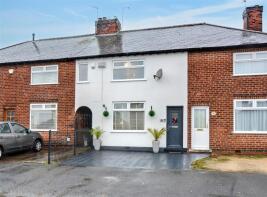
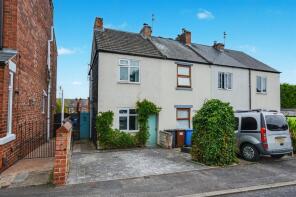
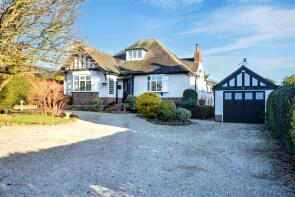
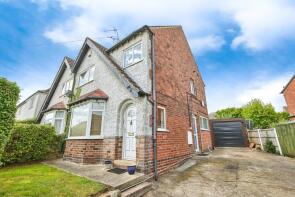
The majority of properties sold in Sandiacre during the last year were semi-detached properties, selling for an average price of £224,029. Detached properties sold for an average of £333,363, with terraced properties fetching £184,969.
Overall, the historical sold prices in Sandiacre over the last year were 1% up on the previous year and 5% up on the 2022 peak of £232,465.
Properties Sold
17, Lancaster Avenue, Sandiacre NG10 5GW
| Today | See what it's worth now |
| 20 Apr 2026 | £245,000 |
No other historical records.
4, Bostocks Lane, Derby DE72 3SX

| Today | See what it's worth now |
| 15 Apr 2026 | £225,000 |
| 8 Dec 2017 | £150,000 |
81, Margaret Avenue, Nottingham NG10 5JW
| Today | See what it's worth now |
| 7 Apr 2026 | £210,000 |
| 11 Dec 2017 | £143,500 |
7, Smedleys Avenue, Nottingham NG10 5JA
| Today | See what it's worth now |
| 31 Mar 2026 | £169,000 |
| 30 Jan 2020 | £114,000 |
39, Rushy Lane, Nottingham NG10 5NN
| Today | See what it's worth now |
| 30 Mar 2026 | £615,000 |
| 27 Jan 2015 | £335,000 |
No other historical records.
38, Spencer Avenue, Nottingham NG10 5DA
| Today | See what it's worth now |
| 30 Mar 2026 | £208,000 |
| 20 Nov 2020 | £188,500 |
No other historical records.
17, Longmoor Lane, Nottingham NG10 5JH

| Today | See what it's worth now |
| 13 Mar 2026 | £100,000 |
| 4 Apr 2014 | £69,000 |
9, Austins Drive, Nottingham NG10 5JX
| Today | See what it's worth now |
| 13 Mar 2026 | £238,000 |
| 22 May 2018 | £145,000 |
10, New Terrace, Nottingham NG10 5PU
| Today | See what it's worth now |
| 12 Mar 2026 | £110,000 |
| 18 Mar 2003 | £59,950 |
5, Norfolk Walk, Nottingham NG10 5NW
| Today | See what it's worth now |
| 12 Mar 2026 | £225,000 |
| 12 Feb 2004 | £125,000 |
No other historical records.
65, Wood Avenue, Nottingham NG10 5FX
| Today | See what it's worth now |
| 11 Mar 2026 | £240,000 |
| 25 Feb 2004 | £40,000 |
No other historical records.
140, Stanton Road, Nottingham NG10 5EP
| Today | See what it's worth now |
| 11 Mar 2026 | £321,000 |
| 16 Oct 2009 | £200,000 |
No other historical records.
8, Victor Crescent, Nottingham NG10 5JT
| Today | See what it's worth now |
| 5 Mar 2026 | £235,500 |
| 26 Feb 2016 | £142,000 |
12, Spencer Avenue, Sandiacre NG10 5DA
| Today | See what it's worth now |
| 2 Mar 2026 | £185,000 |
No other historical records.
12, Richmond Avenue, Sandiacre NG10 5GY
| Today | See what it's worth now |
| 26 Feb 2026 | £242,500 |
No other historical records.
19, King Edward Street, Nottingham NG10 5BS
| Today | See what it's worth now |
| 20 Feb 2026 | £200,000 |
| 18 Dec 2003 | £110,000 |
No other historical records.
3, Lenton Street, Nottingham NG10 5DJ
| Today | See what it's worth now |
| 20 Feb 2026 | £295,000 |
| 28 May 2004 | £165,000 |
6, Cedar Close, Nottingham NG10 5DZ

| Today | See what it's worth now |
| 11 Feb 2026 | £350,000 |
| 21 Aug 2020 | £250,000 |
12, Sycamore Crescent, Nottingham NG10 5EX
| Today | See what it's worth now |
| 11 Feb 2026 | £200,000 |
| 2 Dec 2016 | £120,000 |
No other historical records.
46, Sandringham Road, Sandiacre NG10 5LD
| Today | See what it's worth now |
| 6 Feb 2026 | £150,000 |
No other historical records.
128, Travers Road, Nottingham NG10 5GF
| Today | See what it's worth now |
| 5 Feb 2026 | £213,000 |
| 11 Feb 2022 | £208,500 |
No other historical records.
24, Westminster Avenue, Nottingham NG10 5AT
| Today | See what it's worth now |
| 30 Jan 2026 | £167,000 |
| 12 Jun 2020 | £135,000 |
31, Regent Street, Nottingham NG10 5AU
| Today | See what it's worth now |
| 30 Jan 2026 | £218,000 |
| 10 Dec 2021 | £195,000 |
Source Acknowledgement: © Crown copyright. England and Wales house price data is publicly available information produced by the HM Land Registry.This material was last updated on 9 July 2026. It covers the period from 1 January 1995 to 30 April 2026 and contains property transactions which have been registered during that period. Contains HM Land Registry data © Crown copyright and database right 2026. This data is licensed under the Open Government Licence v3.0.
Disclaimer: Rightmove.co.uk provides this HM Land Registry data "as is". The burden for fitness of the data relies completely with the user and is provided for informational purposes only. No warranty, express or implied, is given relating to the accuracy of content of the HM Land Registry data and Rightmove does not accept any liability for error or omission. If you have found an error with the data or need further information please contact HM Land Registry.
Permitted Use: Viewers of this Information are granted permission to access this Crown copyright material and to download it onto electronic, magnetic, optical or similar storage media provided that such activities are for private research, study or in-house use only. Any other use of the material requires the formal written permission of Land Registry which can be requested from us, and is subject to an additional licence and associated charge.
Rightmove takes no liability for your use of, or reliance on, Rightmove's Instant Valuation due to the limitations of our tracking tool listed here. Use of this tool is taken entirely at your own risk. All rights reserved.