
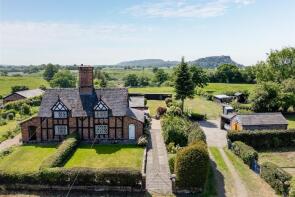
House Prices in Sandybrow
House prices in Sandybrow have an overall average of £505,688 over the last year.
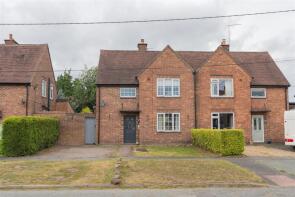
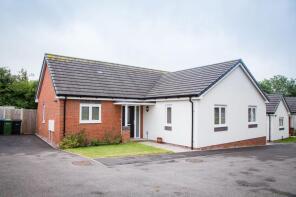
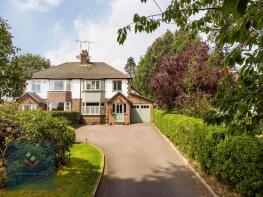
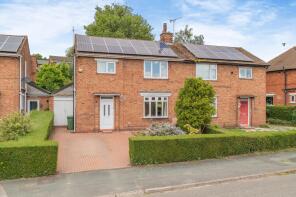
The majority of properties sold in Sandybrow during the last year were detached properties, selling for an average price of £643,284. Semi-detached properties sold for an average of £392,757, with terraced properties fetching £412,059.
Overall, the historical sold prices in Sandybrow over the last year were 3% up on the previous year and 6% down on the 2022 peak of £535,760.
Properties Sold
15, St Peters Drive, Little Budworth, Tarporley CW6 9BZ
| Today | See what it's worth now |
| 16 Apr 2026 | £575,000 |
| 31 May 2012 | £312,500 |
Stable Cottage, Woodlan Court, Wood Lane, Utkinton, Tarporley CW6 0LD

| Today | See what it's worth now |
| 15 Apr 2026 | £740,000 |
| 16 Dec 2020 | £585,000 |
10, Hillside Road, Kelsall, Tarporley CW6 0NT
| Today | See what it's worth now |
| 9 Apr 2026 | £416,000 |
| 12 Mar 1998 | £88,500 |
No other historical records.
3, Orchard Close, Tarporley CW6 9PZ
| Today | See what it's worth now |
| 7 Apr 2026 | £435,000 |
| 27 Sep 1999 | £155,000 |
No other historical records.
Kiln House, Chester Road, Tarporley CW6 9JA
| Today | See what it's worth now |
| 2 Apr 2026 | £465,000 |
| 26 Jun 2007 | £364,100 |
4, Council Houses, Hall Lane, Tarporley CW6 9RH
| Today | See what it's worth now |
| 30 Mar 2026 | £457,000 |
| 16 Jul 2009 | £235,000 |
No other historical records.
10, Walkers Lane, Tarporley CW6 0BX
| Today | See what it's worth now |
| 27 Mar 2026 | £690,000 |
| 2 Mar 2018 | £520,000 |
No other historical records.
3, Carter Avenue, Kelsall, Tarporley CW6 0QD

| Today | See what it's worth now |
| 27 Mar 2026 | £265,000 |
| 27 Sep 2024 | £220,000 |
Stables Cottage, Long Lane, Tarporley CW6 9TB
| Today | See what it's worth now |
| 20 Mar 2026 | £950,500 |
| 3 Apr 2024 | £990,000 |
9, Oswalds Way, Tarporley CW6 0GF
| Today | See what it's worth now |
| 20 Mar 2026 | £409,750 |
| 11 Nov 2015 | £312,000 |
6 Chesterton House, Ridley Croft Barns, Wrexham Road, Tarporley CW6 9SA
| Today | See what it's worth now |
| 20 Mar 2026 | £515,000 |
| 2 Nov 2018 | £425,000 |
No other historical records.
11, Brook Road, Tarporley CW6 9HH
| Today | See what it's worth now |
| 11 Mar 2026 | £335,000 |
| 22 Aug 2003 | £135,000 |
19, Walkers Lane, Tarporley CW6 0BX
| Today | See what it's worth now |
| 6 Mar 2026 | £600,000 |
No other historical records.
27, The Paddock, Tarporley CW6 0BT
| Today | See what it's worth now |
| 6 Mar 2026 | £405,000 |
| 24 Oct 2018 | £279,000 |
No other historical records.
Oak Cottage, Huxley Lane, Tiverton, Tarporley CW6 9NB
| Today | See what it's worth now |
| 6 Mar 2026 | £590,000 |
| 29 Nov 1996 | £85,000 |
No other historical records.
Pinewood Cottage, Whitchurch Road, Beeston, Chester CW6 9GX
| Today | See what it's worth now |
| 27 Feb 2026 | £125,000 |
No other historical records.
Damson House, Brook Road, Tarporley CW6 9HH
| Today | See what it's worth now |
| 26 Feb 2026 | £967,000 |
| 19 Dec 2002 | £465,000 |
No other historical records.
Windgather, Quarry Lane, Kelsall, Tarporley CW6 0PD
| Today | See what it's worth now |
| 26 Feb 2026 | £582,500 |
| 17 Aug 2001 | £248,070 |
No other historical records.
5, Church Row, Tarporley CW6 9PL
| Today | See what it's worth now |
| 25 Feb 2026 | £305,000 |
| 4 Mar 2020 | £170,200 |
8, Green Hill Road, Kelsall, Chester CW6 0SN
| Today | See what it's worth now |
| 25 Feb 2026 | £465,000 |
| 10 Nov 2023 | £415,000 |
No other historical records.
Highlea, Chester Road, Kelsall, Tarporley CW6 0SA
| Today | See what it's worth now |
| 23 Feb 2026 | £565,000 |
| 18 Nov 2008 | £215,000 |
No other historical records.
19, Pasture Close, Kelsall, Tarporley CW6 0PN

| Today | See what it's worth now |
| 23 Feb 2026 | £315,000 |
| 19 Jul 2016 | £210,000 |
40, Churchill Drive, Tarporley CW6 0BY
| Today | See what it's worth now |
| 20 Feb 2026 | £285,000 |
| 16 Apr 1999 | £58,000 |
No other historical records.
Source Acknowledgement: © Crown copyright. England and Wales house price data is publicly available information produced by the HM Land Registry.This material was last updated on 9 July 2026. It covers the period from 1 January 1995 to 30 April 2026 and contains property transactions which have been registered during that period. Contains HM Land Registry data © Crown copyright and database right 2026. This data is licensed under the Open Government Licence v3.0.
Disclaimer: Rightmove.co.uk provides this HM Land Registry data "as is". The burden for fitness of the data relies completely with the user and is provided for informational purposes only. No warranty, express or implied, is given relating to the accuracy of content of the HM Land Registry data and Rightmove does not accept any liability for error or omission. If you have found an error with the data or need further information please contact HM Land Registry.
Permitted Use: Viewers of this Information are granted permission to access this Crown copyright material and to download it onto electronic, magnetic, optical or similar storage media provided that such activities are for private research, study or in-house use only. Any other use of the material requires the formal written permission of Land Registry which can be requested from us, and is subject to an additional licence and associated charge.
Rightmove takes no liability for your use of, or reliance on, Rightmove's Instant Valuation due to the limitations of our tracking tool listed here. Use of this tool is taken entirely at your own risk. All rights reserved.