
House Prices in Boundary Lane, Southwark, London, SE17
House prices in Boundary Lane have an overall average of £430,000 over the last year.
Overall, the historical sold prices in Boundary Lane over the last year were 9% down on the previous year and 12% down on the 2019 peak of £486,000.
Properties Sold
Flat 116, Roffo Court, Boundary Lane, London SE17 2FP

| Today | See what it's worth now |
| 27 Sep 2024 | £430,000 |
| 26 Sep 2013 | £305,000 |
No other historical records.
Flat 123, Roffo Court, Boundary Lane, London SE17 2FP
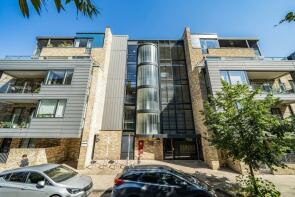
| Today | See what it's worth now |
| 14 May 2024 | £492,500 |
| 26 Mar 2013 | £305,000 |
No other historical records.
Flat A, 4, Boundary Lane, London SE17 2BH
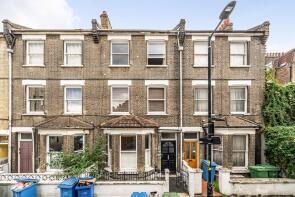
| Today | See what it's worth now |
| 15 Mar 2024 | £509,000 |
| 1 Feb 2016 | £404,000 |
Flat 128, Roffo Court, Boundary Lane, London SE17 2FP
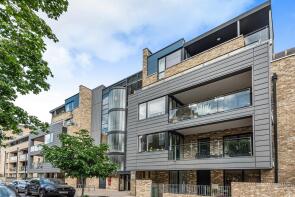
| Today | See what it's worth now |
| 28 Sep 2023 | £355,000 |
| 10 Apr 2013 | £232,500 |
No other historical records.
Flat 77, Roffo Court, Boundary Lane, London SE17 2FP
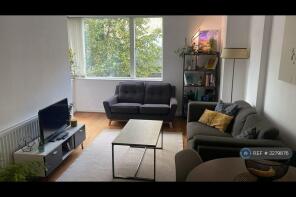
| Today | See what it's worth now |
| 18 Sep 2023 | £537,500 |
| 15 Mar 2013 | £300,000 |
No other historical records.
Flat 81, Roffo Court, Boundary Lane, London SE17 2FP
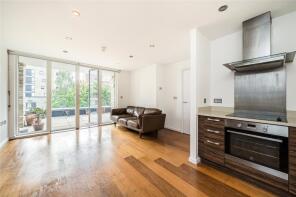
| Today | See what it's worth now |
| 14 Jul 2023 | £525,000 |
| 24 May 2013 | £325,000 |
No other historical records.
Flat 93, Roffo Court, Boundary Lane, London SE17 2FP
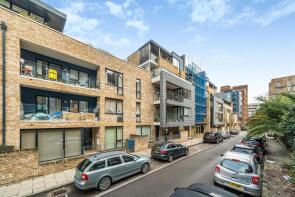
| Today | See what it's worth now |
| 2 Jun 2023 | £425,500 |
| 12 Apr 2013 | £265,000 |
No other historical records.
Flat 117, Roffo Court, Boundary Lane, London SE17 2FP

| Today | See what it's worth now |
| 20 Dec 2019 | £487,000 |
| 18 Mar 2013 | £295,000 |
No other historical records.
Flat 94, Roffo Court, Boundary Lane, London SE17 2FP

| Today | See what it's worth now |
| 8 Mar 2019 | £485,000 |
| 14 Mar 2013 | £280,000 |
No other historical records.
Flat 90, Roffo Court, Boundary Lane, London SE17 2FP
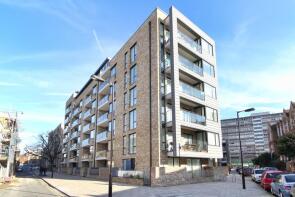
| Today | See what it's worth now |
| 26 Apr 2018 | £390,000 |
No other historical records.
Flat 112, Roffo Court, Boundary Lane, London SE17 2FP
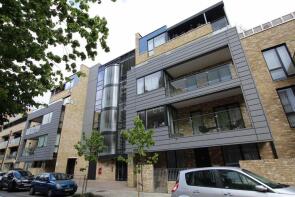
| Today | See what it's worth now |
| 13 Dec 2017 | £392,000 |
| 26 Mar 2013 | £230,000 |
No other historical records.
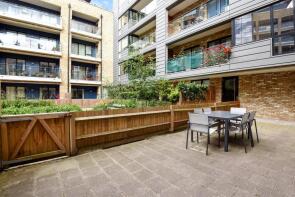
Flat 129, Roffo Court, Boundary Lane, London SE17 2FP
| Today | See what it's worth now |
| 31 Mar 2017 | £485,000 |
| 21 Mar 2013 | £275,000 |
No other historical records.
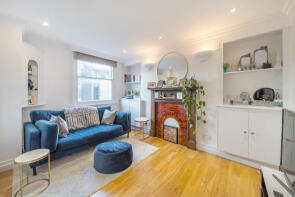
16c, Boundary Lane, London SE17 2BH
| Today | See what it's worth now |
| 13 May 2016 | £520,000 |
| 15 Dec 2010 | £382,000 |
No other historical records.
Flat C, 4, Boundary Lane, London SE17 2BH

| Today | See what it's worth now |
| 1 Feb 2016 | £550,557 |
| 27 Mar 2007 | £150,000 |
No other historical records.
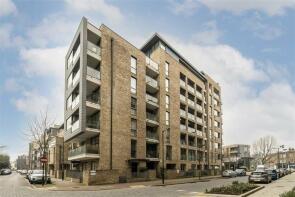
Flat 76, Roffo Court, Boundary Lane, London SE17 2FP
| Today | See what it's worth now |
| 8 Jan 2016 | £355,000 |
No other historical records.
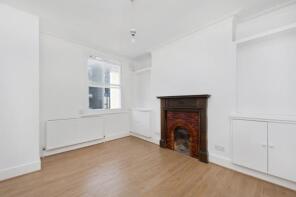
16b, Boundary Lane, London SE17 2BH
| Today | See what it's worth now |
| 12 Feb 2015 | £317,000 |
No other historical records.
Flat B, 4, Boundary Lane, London SE17 2BH

| Today | See what it's worth now |
| 12 Sep 2014 | £315,000 |
| 9 Nov 2006 | £150,000 |
No other historical records.
Flat 104, Roffo Court, Boundary Lane, London SE17 2FP

| Today | See what it's worth now |
| 10 Oct 2013 | £315,000 |
No other historical records.
Flat 89, Roffo Court, Boundary Lane, London SE17 2FP
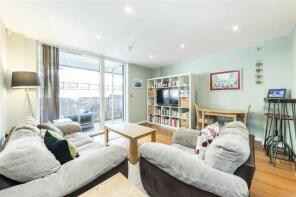
| Today | See what it's worth now |
| 8 Aug 2013 | £285,000 |
No other historical records.
Flat 113, Roffo Court, Boundary Lane, London SE17 2FP
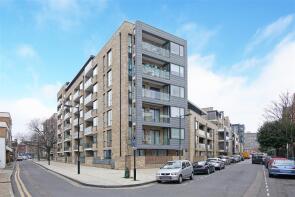
| Today | See what it's worth now |
| 10 Jul 2013 | £320,000 |
No other historical records.
Flat 102, Roffo Court, Boundary Lane, London SE17 2FP
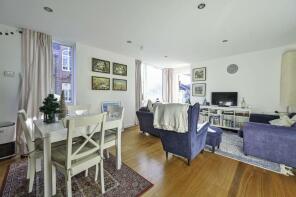
| Today | See what it's worth now |
| 28 Jun 2013 | £397,500 |
No other historical records.
Flat 103, Roffo Court, Boundary Lane, London SE17 2FP
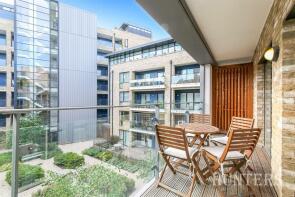
| Today | See what it's worth now |
| 28 Jun 2013 | £305,000 |
No other historical records.
Flat 106, Roffo Court, Boundary Lane, London SE17 2FP
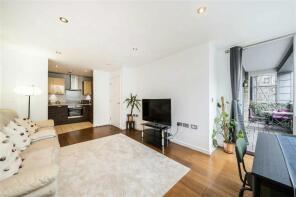
| Today | See what it's worth now |
| 28 Jun 2013 | £295,000 |
No other historical records.
Flat 114, Roffo Court, Boundary Lane, London SE17 2FP
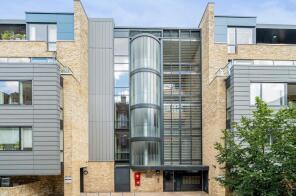
| Today | See what it's worth now |
| 28 Jun 2013 | £330,000 |
No other historical records.
Flat 88, Roffo Court, Boundary Lane, London SE17 2FP
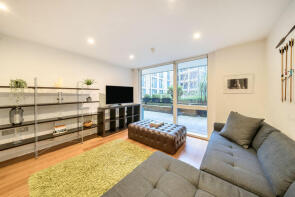
| Today | See what it's worth now |
| 28 Jun 2013 | £307,500 |
No other historical records.
Find out how much your property is worth
The following agents can provide you with a free, no-obligation valuation. Simply select the ones you'd like to hear from.
Sponsored
All featured agents have paid a fee to promote their valuation expertise.

Chase Evans
Elephant and Castle

Foxtons
Elephant & Castle

Global House Estates
London

JS Estate Management
London

Barnard Marcus
Kennington
Get ready with a Mortgage in Principle
- Personalised result in just 20 minutes
- Find out how much you can borrow
- Get viewings faster with agents
- No impact on your credit score
What's your property worth?
Source Acknowledgement: © Crown copyright. England and Wales house price data is publicly available information produced by the HM Land Registry.This material was last updated on 6 August 2025. It covers the period from 1 January 1995 to 30 June 2025 and contains property transactions which have been registered during that period. Contains HM Land Registry data © Crown copyright and database right 2025. This data is licensed under the Open Government Licence v3.0.
Disclaimer: Rightmove.co.uk provides this HM Land Registry data "as is". The burden for fitness of the data relies completely with the user and is provided for informational purposes only. No warranty, express or implied, is given relating to the accuracy of content of the HM Land Registry data and Rightmove does not accept any liability for error or omission. If you have found an error with the data or need further information please contact HM Land Registry.
Permitted Use: Viewers of this Information are granted permission to access this Crown copyright material and to download it onto electronic, magnetic, optical or similar storage media provided that such activities are for private research, study or in-house use only. Any other use of the material requires the formal written permission of Land Registry which can be requested from us, and is subject to an additional licence and associated charge.
Data on planning applications, home extensions and build costs is provided by Resi.co.uk. Planning data is calculated using the last 2 years of residential applications within the selected planning authority. Home extension data, such as build costs and project timelines, are calculated using approximately 9,000 architectural projects Resi has completed, and 23,500 builders quotes submitted via Resi's platform. Build costs are adjusted according to inflation rates to more accurately represent today's prices.
Map data ©OpenStreetMap contributors.
Rightmove takes no liability for your use of, or reliance on, Rightmove's Instant Valuation due to the limitations of our tracking tool listed here. Use of this tool is taken entirely at your own risk. All rights reserved.

