
House Prices in Lancaster Avenue, Lambeth, London, SE27
House prices in Lancaster Avenue have an overall average of £901,143 over the last year.
The majority of properties sold in Lancaster Avenue during the last year were semi-detached properties, selling for an average price of £1,271,000. Flats sold for an average of £465,000, with terraced properties fetching £1,100,000.
Overall, the historical sold prices in Lancaster Avenue over the last year were 32% up on the previous year and 17% down on the 2016 peak of £1,092,100.
Properties Sold
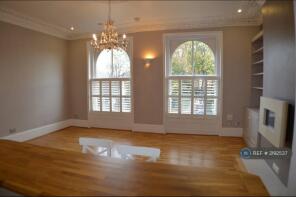
Flat C, 33, Lancaster Avenue, London SE27 9EL
| Today | See what it's worth now |
| 31 Mar 2025 | £600,000 |
| 27 Apr 2012 | £310,222 |
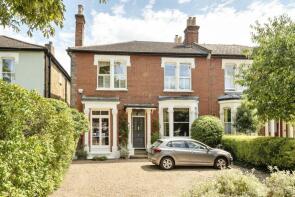
36, Lancaster Avenue, London SE27 9DZ
| Today | See what it's worth now |
| 5 Dec 2024 | £1,850,000 |
No other historical records.
42, Lancaster Court, Lancaster Avenue, London SE27 9HU

| Today | See what it's worth now |
| 2 Dec 2024 | £395,000 |
| 25 Nov 2020 | £375,000 |
No other historical records.
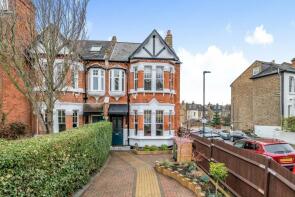
46, Lancaster Avenue, London SE27 9EB
| Today | See what it's worth now |
| 22 Nov 2024 | £1,010,000 |
No other historical records.
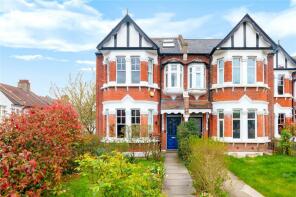
68, Lancaster Avenue, London SE27 9EB
| Today | See what it's worth now |
| 15 Nov 2024 | £1,100,000 |
| 20 Dec 2010 | £567,000 |
40, Lancaster Court, Lancaster Avenue, London SE27 9HU

| Today | See what it's worth now |
| 8 Nov 2024 | £400,000 |
| 25 Nov 2020 | £365,500 |
No other historical records.
12a, Lancaster Avenue, London SE27 9DZ
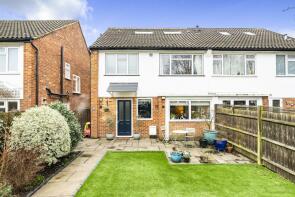
| Today | See what it's worth now |
| 2 Aug 2024 | £953,000 |
| 31 Mar 2016 | £650,000 |
No other historical records.
76, Lancaster Avenue, London SE27 9EB

| Today | See what it's worth now |
| 7 Jun 2024 | £450,000 |
| 7 Feb 2020 | £409,950 |
No other historical records.
26, Lancaster Court, Lancaster Avenue, London SE27 9HU
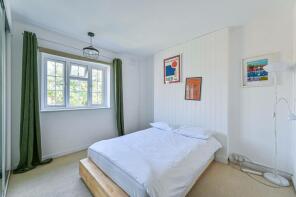
| Today | See what it's worth now |
| 1 Dec 2023 | £380,000 |
| 4 Jun 2014 | £311,000 |
64, Lancaster Avenue, London SE27 9EB
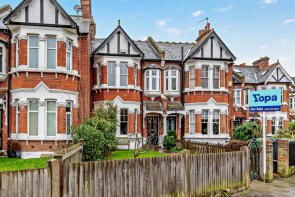
| Today | See what it's worth now |
| 20 Sep 2023 | £952,000 |
| 11 Nov 2003 | £332,000 |
52, Lancaster Avenue, London SE27 9EB
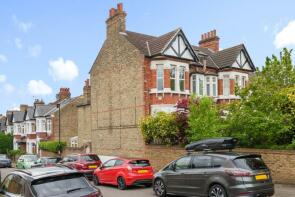
| Today | See what it's worth now |
| 20 Sep 2023 | £950,000 |
| 30 May 2008 | £622,750 |
Flat B, 33, Lancaster Avenue, London SE27 9EL
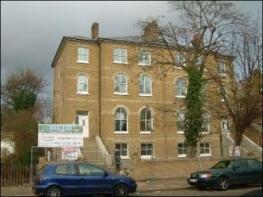
| Today | See what it's worth now |
| 29 Mar 2023 | £435,000 |
No other historical records.
21, Lancaster Avenue, London SE27 9EL
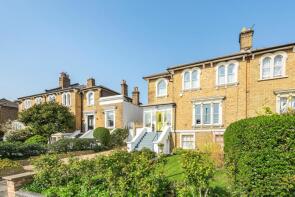
| Today | See what it's worth now |
| 19 Dec 2022 | £1,850,000 |
No other historical records.
10a, Lancaster Avenue, London SE27 9DZ

| Today | See what it's worth now |
| 16 Nov 2022 | £800,000 |
No other historical records.
86, Lancaster Avenue, London SE27 9EB
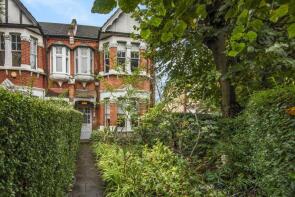
| Today | See what it's worth now |
| 15 Jun 2022 | £1,075,000 |
| 12 Feb 2004 | £345,505 |
No other historical records.
4e, Lancaster Avenue, London SE27 9DZ

| Today | See what it's worth now |
| 18 May 2022 | £895,000 |
| 11 Jun 1999 | £185,000 |
No other historical records.
Flat 1, 44, Lancaster Avenue, London SE27 9DZ
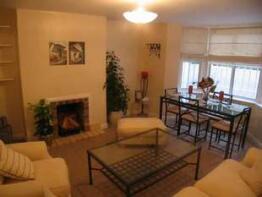
| Today | See what it's worth now |
| 10 May 2022 | £456,000 |
| 16 Aug 2004 | £160,000 |
56, Lancaster Avenue, London SE27 9EB
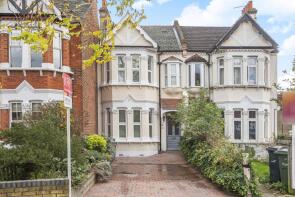
| Today | See what it's worth now |
| 31 Aug 2021 | £1,020,500 |
| 10 Jul 2013 | £625,000 |
No other historical records.
14, Lancaster Avenue, London SE27 9DZ

| Today | See what it's worth now |
| 18 Mar 2021 | £350,000 |
No other historical records.
2, Lancaster Court, Lancaster Avenue, London SE27 9HU
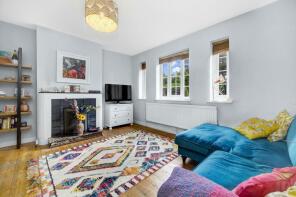
| Today | See what it's worth now |
| 27 Jan 2021 | £297,000 |
| 9 Feb 2018 | £279,000 |
41, Lancaster Court, Lancaster Avenue, London SE27 9HU
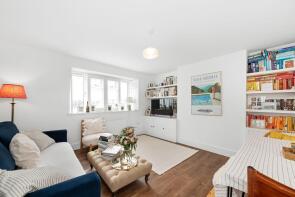
| Today | See what it's worth now |
| 4 Jan 2021 | £375,000 |
No other historical records.
1, Lancaster Avenue, London SE27 9EL
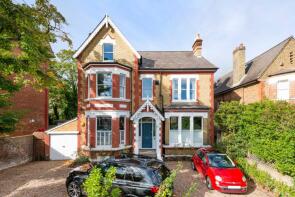
| Today | See what it's worth now |
| 21 Dec 2020 | £2,250,000 |
| 25 Oct 2016 | £1,625,000 |
No other historical records.
37, Lancaster Court, Lancaster Avenue, London SE27 9HU

| Today | See what it's worth now |
| 27 Nov 2020 | £376,000 |
No other historical records.
39, Lancaster Court, Lancaster Avenue, London SE27 9HU

| Today | See what it's worth now |
| 27 Nov 2020 | £367,000 |
No other historical records.
35, Lancaster Court, Lancaster Avenue, London SE27 9HU

| Today | See what it's worth now |
| 25 Nov 2020 | £405,000 |
No other historical records.
Find out how much your property is worth
The following agents can provide you with a free, no-obligation valuation. Simply select the ones you'd like to hear from.
Sponsored
All featured agents have paid a fee to promote their valuation expertise.

Malixons
London

Knight Frank
Dulwich

Stapleton Long
West Norwood

Stirling Ackroyd Sales
Streatham

Pedder
West Norwood

Oaks Estate Agents
Tulse Hill
Get ready with a Mortgage in Principle
- Personalised result in just 20 minutes
- Find out how much you can borrow
- Get viewings faster with agents
- No impact on your credit score
What's your property worth?
House prices near Lancaster Avenue
Source Acknowledgement: © Crown copyright. England and Wales house price data is publicly available information produced by the HM Land Registry.This material was last updated on 6 August 2025. It covers the period from 1 January 1995 to 30 June 2025 and contains property transactions which have been registered during that period. Contains HM Land Registry data © Crown copyright and database right 2025. This data is licensed under the Open Government Licence v3.0.
Disclaimer: Rightmove.co.uk provides this HM Land Registry data "as is". The burden for fitness of the data relies completely with the user and is provided for informational purposes only. No warranty, express or implied, is given relating to the accuracy of content of the HM Land Registry data and Rightmove does not accept any liability for error or omission. If you have found an error with the data or need further information please contact HM Land Registry.
Permitted Use: Viewers of this Information are granted permission to access this Crown copyright material and to download it onto electronic, magnetic, optical or similar storage media provided that such activities are for private research, study or in-house use only. Any other use of the material requires the formal written permission of Land Registry which can be requested from us, and is subject to an additional licence and associated charge.
Data on planning applications, home extensions and build costs is provided by Resi.co.uk. Planning data is calculated using the last 2 years of residential applications within the selected planning authority. Home extension data, such as build costs and project timelines, are calculated using approximately 9,000 architectural projects Resi has completed, and 23,500 builders quotes submitted via Resi's platform. Build costs are adjusted according to inflation rates to more accurately represent today's prices.
Map data ©OpenStreetMap contributors.
Rightmove takes no liability for your use of, or reliance on, Rightmove's Instant Valuation due to the limitations of our tracking tool listed here. Use of this tool is taken entirely at your own risk. All rights reserved.

