
House Prices in Weston Way, Baldock, Hertfordshire, SG7
House prices in Weston Way have an overall average of £492,333 over the last year.
The majority of properties sold in Weston Way during the last year were terraced properties, selling for an average price of £566,000. Semi-detached properties sold for an average of £345,000.
Overall, the historical sold prices in Weston Way over the last year were 88% up on the previous year and 4% up on the 2019 peak of £471,667.
Properties Sold
47, Weston Way, Baldock SG7 6EZ
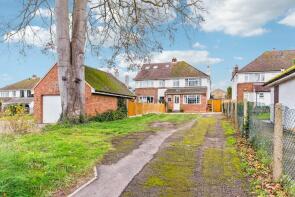
| Today | See what it's worth now |
| 31 Mar 2025 | £580,000 |
| 29 Aug 2008 | £218,000 |
No other historical records.
90, Weston Way, Baldock SG7 6HF
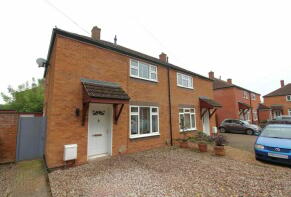
| Today | See what it's worth now |
| 16 Dec 2024 | £345,000 |
No other historical records.
179, Weston Way, Baldock SG7 6JG
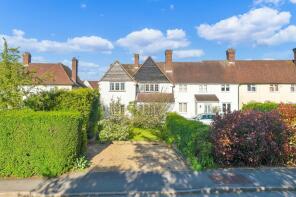
| Today | See what it's worth now |
| 22 Aug 2024 | £552,000 |
| 27 Aug 2002 | £155,000 |
No other historical records.
2, Knights Court, Weston Way, Baldock SG7 6JG

| Today | See what it's worth now |
| 29 Feb 2024 | £265,000 |
| 18 Aug 2017 | £221,000 |
7, Knights Court, Weston Way, Baldock SG7 6JG
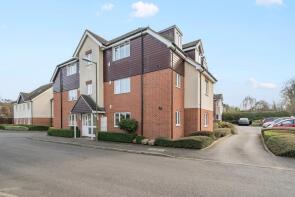
| Today | See what it's worth now |
| 16 Aug 2023 | £260,000 |
| 2 Apr 2009 | £158,000 |
No other historical records.
39, Weston Way, Baldock SG7 6EZ
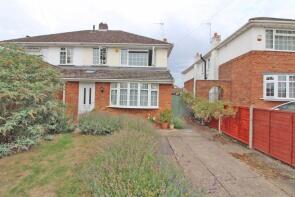
| Today | See what it's worth now |
| 2 May 2023 | £567,500 |
| 3 Jan 2007 | £265,000 |
54, Weston Way, Baldock SG7 6HB
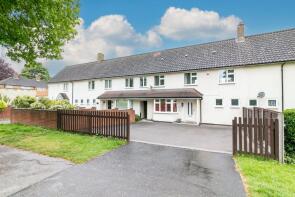
| Today | See what it's worth now |
| 14 Nov 2022 | £420,500 |
| 10 Dec 2012 | £185,000 |
56, Weston Way, Baldock SG7 6HB
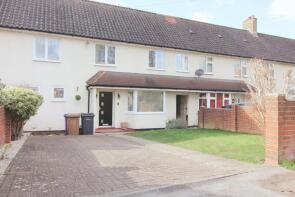
| Today | See what it's worth now |
| 10 Nov 2022 | £425,000 |
| 25 May 2007 | £210,000 |
14, Knights Court, Weston Way, Baldock SG7 6JG

| Today | See what it's worth now |
| 13 May 2022 | £230,000 |
| 17 Dec 2015 | £199,950 |
57, Weston Way, Baldock SG7 6EZ
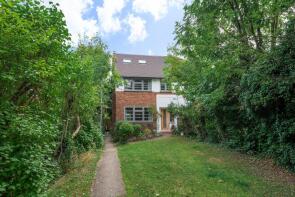
| Today | See what it's worth now |
| 1 Mar 2022 | £550,000 |
| 1 Nov 2005 | £238,000 |
No other historical records.
42, Weston Way, Baldock SG7 6HA
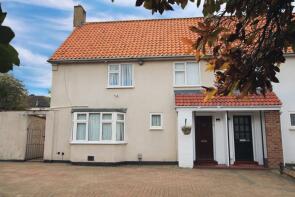
| Today | See what it's worth now |
| 14 Feb 2022 | £373,000 |
No other historical records.
50, Weston Way, Baldock SG7 6HA

| Today | See what it's worth now |
| 10 Dec 2021 | £425,000 |
| 25 Oct 2017 | £330,000 |
85, The Spinney, Weston Way, Baldock SG7 6HD

| Today | See what it's worth now |
| 25 Oct 2021 | £390,000 |
| 24 Aug 2010 | £235,000 |
16, Knights Court, Weston Way, Baldock SG7 6JG

| Today | See what it's worth now |
| 24 Jun 2021 | £255,000 |
| 29 Oct 2010 | £156,000 |
No other historical records.
181, Weston Way, Baldock SG7 6JG
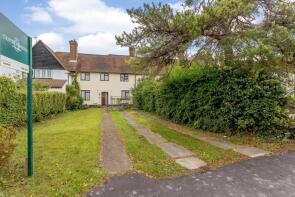
| Today | See what it's worth now |
| 15 Apr 2020 | £355,000 |
| 4 Dec 1998 | £78,000 |
No other historical records.
199, Weston Way, Baldock SG7 6JG
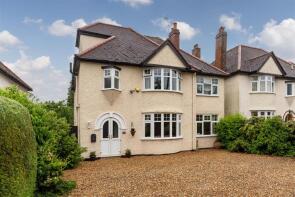
| Today | See what it's worth now |
| 16 Dec 2019 | £775,000 |
No other historical records.
213, Weston Way, Baldock SG7 6JG

| Today | See what it's worth now |
| 22 Nov 2019 | £385,000 |
No other historical records.
61, Weston Way, Baldock SG7 6EZ

| Today | See what it's worth now |
| 7 Aug 2019 | £485,000 |
No other historical records.
217, Weston Way, Baldock SG7 6JG
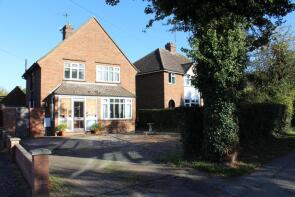
| Today | See what it's worth now |
| 21 Jun 2019 | £435,000 |
| 10 Mar 1998 | £115,000 |
No other historical records.
53, Weston Way, Baldock SG7 6EZ
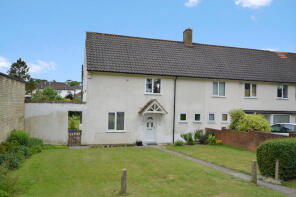
| Today | See what it's worth now |
| 21 Jun 2019 | £380,000 |
No other historical records.
49, Weston Way, Baldock SG7 6EZ
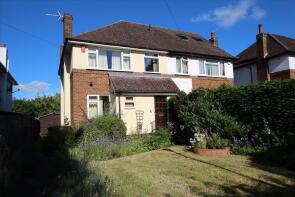
| Today | See what it's worth now |
| 31 May 2019 | £370,000 |
No other historical records.
23, Weston Way, Baldock SG7 6EY
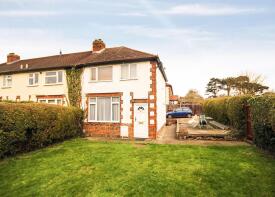
| Today | See what it's worth now |
| 13 Dec 2018 | £310,000 |
| 30 Apr 1999 | £76,000 |
No other historical records.
195, Weston Way, Baldock SG7 6JG

| Today | See what it's worth now |
| 16 Mar 2018 | £582,500 |
No other historical records.
59, Weston Way, Baldock SG7 6EZ
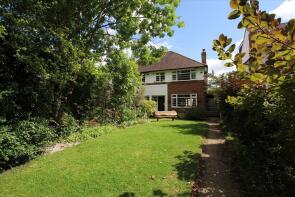
| Today | See what it's worth now |
| 8 Feb 2018 | £420,000 |
| 19 Dec 2001 | £168,000 |
No other historical records.
79, Weston Way, Baldock SG7 6HB

| Today | See what it's worth now |
| 17 Oct 2017 | £170,000 |
No other historical records.
Find out how much your property is worth
The following agents can provide you with a free, no-obligation valuation. Simply select the ones you'd like to hear from.
Sponsored
All featured agents have paid a fee to promote their valuation expertise.

Country Properties
Baldock

Connells
Letchworth Garden City

Abode Town and Country
Royston

Lane & Bennetts
Letchworth

Satchells Estate Agents
Baldock
Get ready with a Mortgage in Principle
- Personalised result in just 20 minutes
- Find out how much you can borrow
- Get viewings faster with agents
- No impact on your credit score
What's your property worth?
Source Acknowledgement: © Crown copyright. England and Wales house price data is publicly available information produced by the HM Land Registry.This material was last updated on 25 June 2025. It covers the period from 1 January 1995 to 30 April 2025 and contains property transactions which have been registered during that period. Contains HM Land Registry data © Crown copyright and database right 2025. This data is licensed under the Open Government Licence v3.0.
Disclaimer: Rightmove.co.uk provides this HM Land Registry data "as is". The burden for fitness of the data relies completely with the user and is provided for informational purposes only. No warranty, express or implied, is given relating to the accuracy of content of the HM Land Registry data and Rightmove does not accept any liability for error or omission. If you have found an error with the data or need further information please contact HM Land Registry.
Permitted Use: Viewers of this Information are granted permission to access this Crown copyright material and to download it onto electronic, magnetic, optical or similar storage media provided that such activities are for private research, study or in-house use only. Any other use of the material requires the formal written permission of Land Registry which can be requested from us, and is subject to an additional licence and associated charge.
Map data ©OpenStreetMap contributors.
Rightmove takes no liability for your use of, or reliance on, Rightmove's Instant Valuation due to the limitations of our tracking tool listed here. Use of this tool is taken entirely at your own risk. All rights reserved.
