
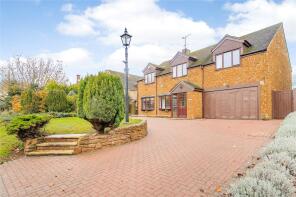
House Prices in Shenington
House prices in Shenington have an overall average of £530,000 over the last year.
The majority of properties sold in Shenington during the last year were semi-detached properties, selling for an average price of £480,000. Terraced properties sold for an average of £580,000.
Overall, the historical sold prices in Shenington over the last year were 30% down on the previous year and 35% down on the 2022 peak of £815,949.
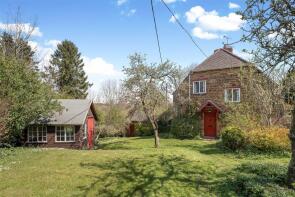
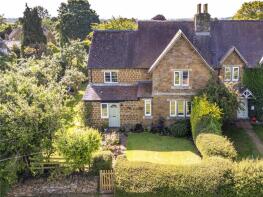
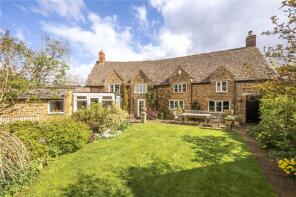
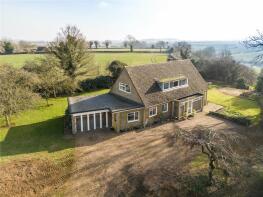
Properties Sold
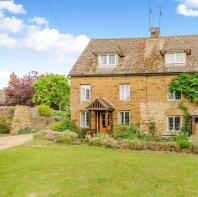
Kelmscott, Street Through Shenington, Banbury OX15 6NH
| Today | See what it's worth now |
| 5 Sep 2025 | £480,000 |
| 30 Jun 2010 | £865,000 |
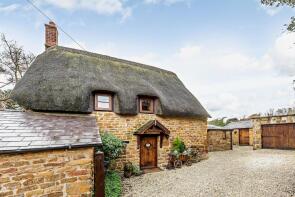
Leys View Cottage, Rattlecombe Road, Banbury OX15 6LZ
| Today | See what it's worth now |
| 7 Aug 2025 | £580,000 |
| 29 Nov 2016 | £430,000 |
No other historical records.
Yew Cottage, The Green, Shenington OX15 6NG
| Today | See what it's worth now |
| 25 Sep 2024 | £850,000 |
No other historical records.
2 Birch Bank, Marshalls Close, Banbury OX15 6NB

| Today | See what it's worth now |
| 27 Jun 2024 | £675,000 |
| 2 Jun 2008 | £575,000 |
The Shires, Street Through Shenington, Shenington OX15 6NH

| Today | See what it's worth now |
| 24 May 2024 | £412,000 |
No other historical records.
Random Ridge, The Level, Banbury OX15 6NA
| Today | See what it's worth now |
| 19 Apr 2024 | £785,000 |
No other historical records.
Monks Brew, Mill Lane, Shenington OX15 6NB
| Today | See what it's worth now |
| 16 Nov 2023 | £625,000 |
| 30 Jan 2013 | £550,000 |
Cedarwood, The Level, Banbury OX15 6NA

| Today | See what it's worth now |
| 20 Sep 2023 | £425,000 |
| 17 Aug 2016 | £309,000 |
The Old Bakery, Street Through Shenington, Banbury OX15 6NH

| Today | See what it's worth now |
| 14 Jul 2023 | £1,250,000 |
| 27 Jan 2004 | £680,000 |
Windwistle, The Green, Banbury OX15 6NE
| Today | See what it's worth now |
| 16 Dec 2022 | £807,246 |
| 3 Oct 2002 | £362,000 |
No other historical records.
3 Stratton House, Marshalls Close, Banbury OX15 6ND
| Today | See what it's worth now |
| 2 Dec 2022 | £1,700,000 |
| 22 Jan 2019 | £1,100,000 |
Moonstone, The Level, Banbury OX15 6NA
| Today | See what it's worth now |
| 14 Apr 2022 | £765,000 |
| 22 Sep 2006 | £390,000 |
Green End Cottage, The Green, Banbury OX15 6NE

| Today | See what it's worth now |
| 5 Apr 2022 | £497,500 |
| 10 Dec 2018 | £455,000 |
The Bell Cottage, The Green, Banbury OX15 6NQ

| Today | See what it's worth now |
| 31 Mar 2022 | £310,000 |
No other historical records.
1, The Green, Banbury OX15 6NQ
| Today | See what it's worth now |
| 17 Nov 2021 | £485,000 |
| 17 Dec 2012 | £230,000 |
No other historical records.
April Cottage, The Green, Banbury OX15 6NE
| Today | See what it's worth now |
| 21 May 2021 | £450,000 |
| 14 Apr 2014 | £244,000 |
No other historical records.
Level End House, The Level, Banbury OX15 6NA

| Today | See what it's worth now |
| 7 May 2021 | £487,000 |
No other historical records.
Greenacres, Rattlecombe Road, Banbury OX15 6LZ
| Today | See what it's worth now |
| 19 Aug 2020 | £399,950 |
No other historical records.
Oak House, Stocking Lane, Banbury OX15 6NF
| Today | See what it's worth now |
| 5 Jun 2020 | £540,000 |
No other historical records.
Ash Lodge, Stocking Lane, Banbury OX15 6NF
| Today | See what it's worth now |
| 16 Aug 2019 | £625,000 |
No other historical records.
Lilac Cottage, Rattlecombe Road, Banbury OX15 6LZ
| Today | See what it's worth now |
| 15 Aug 2019 | £320,000 |
No other historical records.
The Hay Barn, Rattlecombe Road, Banbury OX15 6LZ
| Today | See what it's worth now |
| 9 Aug 2019 | £635,000 |
No other historical records.
5, Long Acre, Stocking Lane, Banbury OX15 6NF

| Today | See what it's worth now |
| 5 Jul 2019 | £610,000 |
| 1 May 2009 | £452,500 |
No other historical records.

Source Acknowledgement: © Crown copyright. England and Wales house price data is publicly available information produced by the HM Land Registry.This material was last updated on 9 July 2026. It covers the period from 1 January 1995 to 30 April 2026 and contains property transactions which have been registered during that period. Contains HM Land Registry data © Crown copyright and database right 2026. This data is licensed under the Open Government Licence v3.0.
Disclaimer: Rightmove.co.uk provides this HM Land Registry data "as is". The burden for fitness of the data relies completely with the user and is provided for informational purposes only. No warranty, express or implied, is given relating to the accuracy of content of the HM Land Registry data and Rightmove does not accept any liability for error or omission. If you have found an error with the data or need further information please contact HM Land Registry.
Permitted Use: Viewers of this Information are granted permission to access this Crown copyright material and to download it onto electronic, magnetic, optical or similar storage media provided that such activities are for private research, study or in-house use only. Any other use of the material requires the formal written permission of Land Registry which can be requested from us, and is subject to an additional licence and associated charge.
Rightmove takes no liability for your use of, or reliance on, Rightmove's Instant Valuation due to the limitations of our tracking tool listed here. Use of this tool is taken entirely at your own risk. All rights reserved.