
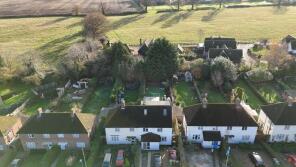
House Prices in Shenleybury
House prices in Shenleybury have an overall average of £613,053 over the last year.
The majority of properties sold in Shenleybury during the last year were semi-detached properties, selling for an average price of £601,979. Terraced properties sold for an average of £497,909, with detached properties fetching £753,000.
Overall, the historical sold prices in Shenleybury over the last year were 5% down on the previous year and 20% down on the 2022 peak of £762,335.
Properties Sold
17, Greenwood Gardens, Radlett WD7 9LF
| Today | See what it's worth now |
| 30 Mar 2026 | £680,000 |
| 4 Oct 2012 | £380,000 |
20, Heath Way, Shenley, Radlett WD7 9FG
| Today | See what it's worth now |
| 27 Mar 2026 | £495,000 |
| 26 Jun 2020 | £435,000 |
No other historical records.
1, Blenheim Mews, Radlett WD7 9LL
| Today | See what it's worth now |
| 20 Mar 2026 | £660,000 |
| 8 Feb 2021 | £540,000 |
31, Newcome Road, Radlett WD7 9EH
| Today | See what it's worth now |
| 20 Mar 2026 | £565,000 |
| 21 Jun 2023 | £490,000 |
20, Juniper Gardens, Radlett WD7 9LA
| Today | See what it's worth now |
| 13 Mar 2026 | £1,060,000 |
| 28 Apr 2004 | £580,000 |
1, Anderson Road, Radlett WD7 9EQ
| Today | See what it's worth now |
| 27 Feb 2026 | £516,750 |
| 26 Feb 1999 | £60,000 |
No other historical records.
40, King Charles Road, Radlett WD7 9HZ
| Today | See what it's worth now |
| 12 Feb 2026 | £610,000 |
| 31 Jan 2002 | £250,000 |
No other historical records.
10, Andrew Close, Radlett WD7 9LN
| Today | See what it's worth now |
| 18 Dec 2025 | £472,500 |
| 7 Oct 2016 | £395,000 |
9, Harris Lane, Radlett WD7 9ED
| Today | See what it's worth now |
| 18 Dec 2025 | £855,000 |
| 13 Jan 2020 | £772,000 |
7, Hillcrest Road, Radlett WD7 9DB
| Today | See what it's worth now |
| 18 Dec 2025 | £710,000 |
| 31 Mar 2022 | £700,000 |
No other historical records.
6, Birchwood, Newcome Road, Radlett WD7 9ET
| Today | See what it's worth now |
| 16 Dec 2025 | £530,000 |
| 23 Oct 2020 | £390,000 |
No other historical records.
18, Birchwood, Newcome Road, Radlett WD7 9ET
| Today | See what it's worth now |
| 12 Dec 2025 | £475,000 |
| 1 Jul 2020 | £430,000 |
16, New Road, Shenley WD7 9EA
| Today | See what it's worth now |
| 10 Dec 2025 | £417,000 |
No other historical records.
47, Harper Lane, Shenley, Radlett WD7 9HE
| Today | See what it's worth now |
| 5 Dec 2025 | £485,000 |
| 11 Sep 2006 | £230,000 |
5, Shenleybury Farm Cottages, Shenleybury, Radlett WD7 9DL
| Today | See what it's worth now |
| 5 Dec 2025 | £662,500 |
| 6 Jul 2006 | £156,250 |
No other historical records.
15, Fielders Way, Radlett WD7 9EY
| Today | See what it's worth now |
| 28 Nov 2025 | £448,000 |
| 12 May 2017 | £380,000 |
39, King Charles Road, Radlett WD7 9HZ
| Today | See what it's worth now |
| 26 Nov 2025 | £535,000 |
| 27 Apr 2012 | £330,000 |
41, Newcome Road, Radlett WD7 9EH
| Today | See what it's worth now |
| 14 Nov 2025 | £588,000 |
| 20 Sep 2010 | £330,000 |
Kitwells Lodge, Green Street, Shenley WD7 9BD
| Today | See what it's worth now |
| 31 Oct 2025 | £950,000 |
No other historical records.
15, North Avenue, Shenley WD7 9DF
| Today | See what it's worth now |
| 28 Oct 2025 | £560,000 |
No other historical records.
5, Trafford Close, Radlett WD7 9HU
| Today | See what it's worth now |
| 24 Oct 2025 | £377,500 |
| 14 Jan 2005 | £207,500 |
18, Mulberry Gardens, Radlett WD7 9LB

| Today | See what it's worth now |
| 10 Oct 2025 | £622,000 |
| 23 Feb 2012 | £405,000 |
21, New Road, Radlett WD7 9DZ
| Today | See what it's worth now |
| 1 Oct 2025 | £675,000 |
| 30 Apr 2015 | £482,500 |
Source Acknowledgement: © Crown copyright. England and Wales house price data is publicly available information produced by the HM Land Registry.This material was last updated on 9 July 2026. It covers the period from 1 January 1995 to 30 April 2026 and contains property transactions which have been registered during that period. Contains HM Land Registry data © Crown copyright and database right 2026. This data is licensed under the Open Government Licence v3.0.
Disclaimer: Rightmove.co.uk provides this HM Land Registry data "as is". The burden for fitness of the data relies completely with the user and is provided for informational purposes only. No warranty, express or implied, is given relating to the accuracy of content of the HM Land Registry data and Rightmove does not accept any liability for error or omission. If you have found an error with the data or need further information please contact HM Land Registry.
Permitted Use: Viewers of this Information are granted permission to access this Crown copyright material and to download it onto electronic, magnetic, optical or similar storage media provided that such activities are for private research, study or in-house use only. Any other use of the material requires the formal written permission of Land Registry which can be requested from us, and is subject to an additional licence and associated charge.
Rightmove takes no liability for your use of, or reliance on, Rightmove's Instant Valuation due to the limitations of our tracking tool listed here. Use of this tool is taken entirely at your own risk. All rights reserved.