
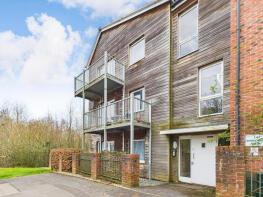
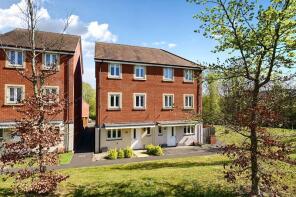
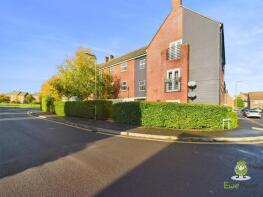
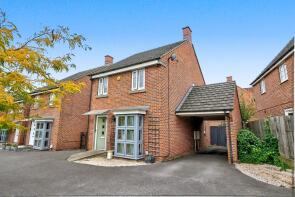
House Prices in Sherborne St. John
House prices in Sherborne St. John have an overall average of £365,342 over the last year.
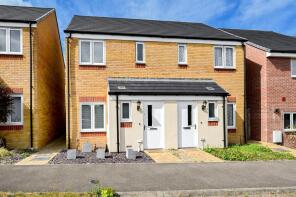
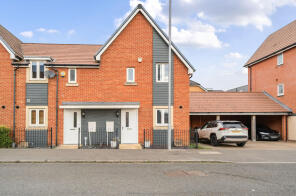
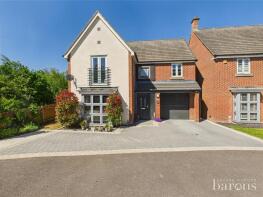
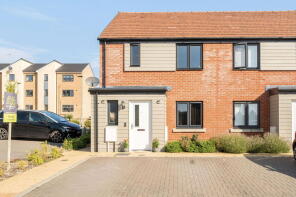
The majority of properties sold in Sherborne St. John during the last year were semi-detached properties, selling for an average price of £385,179. Terraced properties sold for an average of £329,350, with detached properties fetching £527,333.
Overall, the historical sold prices in Sherborne St. John over the last year were 8% down on the previous year and 11% down on the 2022 peak of £411,175.
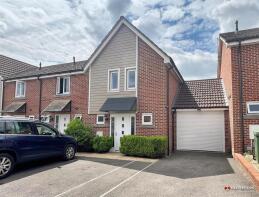
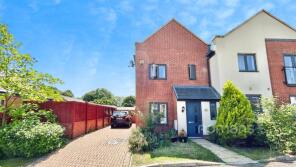
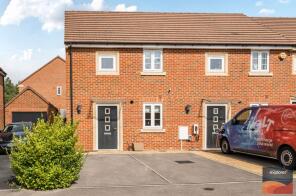
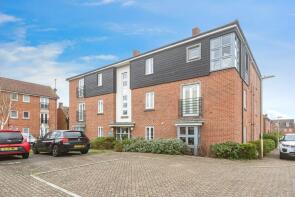
Properties Sold
2, Shrivenham Walk, Basingstoke RG24 9GR
| Today | See what it's worth now |
| 9 Apr 2026 | £155,000 |
| 26 Feb 2021 | £148,000 |
10, Somerville Gardens, Basingstoke RG24 9XF
| Today | See what it's worth now |
| 2 Apr 2026 | £450,000 |
| 18 Dec 2017 | £380,000 |
5, Penton Way, Basingstoke RG24 9RT
| Today | See what it's worth now |
| 30 Mar 2026 | £172,000 |
| 24 Jun 2020 | £174,000 |
19, Gardiner Road, Basingstoke RG24 9FH
| Today | See what it's worth now |
| 27 Mar 2026 | £390,000 |
| 13 Sep 2018 | £332,500 |
7, Wheeler Way, Basingstoke RG24 9TQ
| Today | See what it's worth now |
| 20 Mar 2026 | £345,000 |
| 29 Jun 2018 | £277,500 |
12, Christ Church Gardens, Basingstoke RG24 9QP
| Today | See what it's worth now |
| 16 Mar 2026 | £360,000 |
| 15 Jan 2018 | £292,950 |
No other historical records.
44, Hasker Road, Basingstoke RG24 9NF
| Today | See what it's worth now |
| 13 Mar 2026 | £375,000 |
| 19 Dec 2018 | £304,000 |
No other historical records.
54, Englefield Way, Basingstoke RG24 9FJ
| Today | See what it's worth now |
| 27 Feb 2026 | £113,000 |
| 4 Feb 2022 | £160,000 |
17, Tyfield, Basingstoke RG24 9HZ

| Today | See what it's worth now |
| 27 Feb 2026 | £720,000 |
| 13 Jun 2014 | £450,000 |
16, Egerton Drive, Basingstoke RG24 9FG
| Today | See what it's worth now |
| 27 Feb 2026 | £417,000 |
| 3 Mar 2008 | £250,000 |
No other historical records.
15, Miles Road, Basingstoke RG24 9ZW
| Today | See what it's worth now |
| 27 Feb 2026 | £412,500 |
| 16 May 2017 | £335,000 |
No other historical records.
14, Dancers Meadow, Basingstoke RG24 9LT

| Today | See what it's worth now |
| 26 Feb 2026 | £365,000 |
| 27 May 2016 | £280,000 |
12, Marston Walk, Basingstoke RG24 9FS
| Today | See what it's worth now |
| 16 Feb 2026 | £325,000 |
| 14 Jul 2017 | £280,000 |
36, Hewitt Road, Basingstoke RG24 9FL
| Today | See what it's worth now |
| 16 Feb 2026 | £385,000 |
| 7 Dec 2023 | £355,000 |
7, St Hilda Gardens, Basingstoke RG24 9QN
| Today | See what it's worth now |
| 13 Feb 2026 | £330,000 |
| 5 Jul 2019 | £245,000 |
11, Nuffield Way, Basingstoke RG24 9QL
| Today | See what it's worth now |
| 13 Feb 2026 | £313,000 |
| 6 Nov 2020 | £255,000 |
33, Trinity Way, Basingstoke RG24 9AD
| Today | See what it's worth now |
| 13 Feb 2026 | £305,000 |
| 30 Apr 2021 | £265,000 |
118, Appleton Drive, Basingstoke RG24 9RX
| Today | See what it's worth now |
| 6 Feb 2026 | £547,500 |
| 18 Dec 2008 | £283,240 |
No other historical records.
14, Bloxham Close, Basingstoke RG24 9YS
| Today | See what it's worth now |
| 5 Feb 2026 | £350,000 |
| 20 Nov 2020 | £315,000 |
No other historical records.
9, Bloxham Close, Basingstoke RG24 9YS

| Today | See what it's worth now |
| 4 Feb 2026 | £181,000 |
| 17 Feb 2021 | £88,750 |
No other historical records.
71, Oxford Way, Basingstoke RG24 9FP
| Today | See what it's worth now |
| 4 Feb 2026 | £225,000 |
| 30 Jan 2020 | £220,950 |
No other historical records.
28, Warner Close, Basingstoke RG24 9RY
| Today | See what it's worth now |
| 2 Feb 2026 | £400,000 |
| 28 Sep 2015 | £315,000 |
31, Trinity Way, Basingstoke RG24 9AD
| Today | See what it's worth now |
| 28 Jan 2026 | £295,000 |
| 14 Aug 2020 | £263,000 |
Source Acknowledgement: © Crown copyright. England and Wales house price data is publicly available information produced by the HM Land Registry.This material was last updated on 9 July 2026. It covers the period from 1 January 1995 to 30 April 2026 and contains property transactions which have been registered during that period. Contains HM Land Registry data © Crown copyright and database right 2026. This data is licensed under the Open Government Licence v3.0.
Disclaimer: Rightmove.co.uk provides this HM Land Registry data "as is". The burden for fitness of the data relies completely with the user and is provided for informational purposes only. No warranty, express or implied, is given relating to the accuracy of content of the HM Land Registry data and Rightmove does not accept any liability for error or omission. If you have found an error with the data or need further information please contact HM Land Registry.
Permitted Use: Viewers of this Information are granted permission to access this Crown copyright material and to download it onto electronic, magnetic, optical or similar storage media provided that such activities are for private research, study or in-house use only. Any other use of the material requires the formal written permission of Land Registry which can be requested from us, and is subject to an additional licence and associated charge.
Rightmove takes no liability for your use of, or reliance on, Rightmove's Instant Valuation due to the limitations of our tracking tool listed here. Use of this tool is taken entirely at your own risk. All rights reserved.