
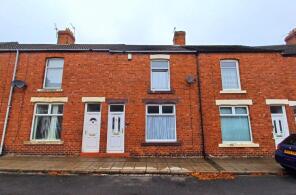
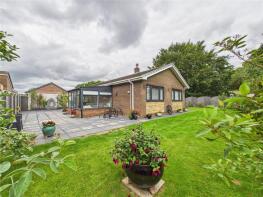
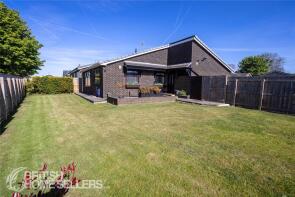
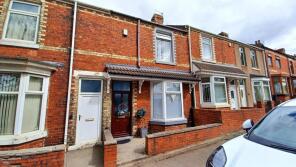
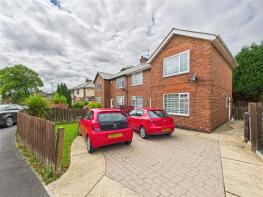
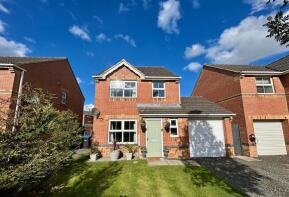
House Prices in Shildon
House prices in Shildon have an overall average of £102,117 over the last year.
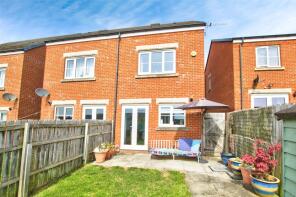
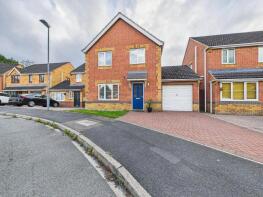
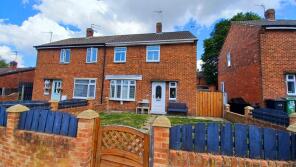
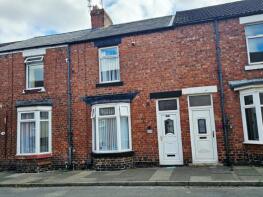
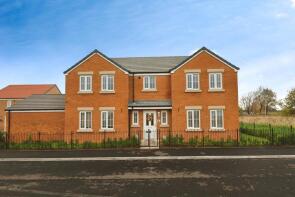
The majority of properties sold in Shildon during the last year were terraced properties, selling for an average price of £70,932. Semi-detached properties sold for an average of £97,071, with detached properties fetching £243,336.
Overall, the historical sold prices in Shildon over the last year were 4% up on the previous year and 5% up on the 2023 peak of £97,675.
Properties Sold
7, Sterling Way, Shildon DL4 2GT

| Today | See what it's worth now |
| 24 Apr 2026 | £146,500 |
| 8 Jun 2018 | £114,950 |
No other historical records.
12, Sunnydale, Shildon DL4 2ER

| Today | See what it's worth now |
| 22 Apr 2026 | £92,000 |
| 5 Feb 2016 | £59,995 |
No other historical records.
14, Queensway, Shildon DL4 2BQ

| Today | See what it's worth now |
| 17 Apr 2026 | £72,500 |
| 27 Feb 2006 | £52,500 |
No other historical records.
5, Waterloo Terrace, Shildon DL4 1AU

| Today | See what it's worth now |
| 13 Apr 2026 | £39,999 |
| 18 Feb 2009 | £70,000 |
No other historical records.
86, Redworth Road, Shildon DL4 2JS
| Today | See what it's worth now |
| 8 Apr 2026 | £80,000 |
| 15 Dec 2014 | £50,000 |
17, Tynedale Walk, Shildon DL4 2DD

| Today | See what it's worth now |
| 27 Mar 2026 | £80,000 |
| 7 Apr 2017 | £35,000 |
No other historical records.
10, Foundry Street, Shildon DL4 2HE
| Today | See what it's worth now |
| 26 Mar 2026 | £57,000 |
| 23 Apr 2004 | £44,000 |
35, Drummond Way, Shildon DL4 2GB
| Today | See what it's worth now |
| 25 Mar 2026 | £132,000 |
| 26 Mar 2014 | £124,950 |
No other historical records.
4, Celandine Way, Shildon DL4 2DT
| Today | See what it's worth now |
| 23 Mar 2026 | £170,000 |
| 19 Dec 2006 | £154,995 |
No other historical records.
51, Dale Road, Shildon DL4 2LD
| Today | See what it's worth now |
| 20 Mar 2026 | £48,000 |
| 22 Dec 1995 | £21,500 |
No other historical records.
11, Maple Avenue, Shildon DL4 2AQ
| Today | See what it's worth now |
| 20 Mar 2026 | £78,000 |
| 19 Apr 2021 | £75,000 |
No other historical records.
14, Farndale Gardens, Shildon DL4 2LZ
| Today | See what it's worth now |
| 20 Mar 2026 | £223,000 |
| 27 Apr 2018 | £178,000 |
19, Almond Court, Shildon DL4 2RG
| Today | See what it's worth now |
| 16 Mar 2026 | £43,249 |
| 19 Sep 2003 | £32,000 |
No other historical records.
16, Dale Road, Shildon DL4 2LA

| Today | See what it's worth now |
| 13 Mar 2026 | £60,000 |
No other historical records.
212, Byerley Road, Shildon DL4 1HW
| Today | See what it's worth now |
| 13 Mar 2026 | £60,000 |
| 13 Jul 2012 | £66,000 |
No other historical records.
9, Byerley Road, Shildon DL4 1JJ
| Today | See what it's worth now |
| 13 Mar 2026 | £59,000 |
| 23 Apr 2004 | £50,000 |
6, Eskdale Gardens, Shildon DL4 2LY
| Today | See what it's worth now |
| 12 Mar 2026 | £302,500 |
| 4 Nov 2024 | £290,000 |
38, Dalton Crescent, Shildon DL4 2LF
| Today | See what it's worth now |
| 6 Mar 2026 | £63,000 |
| 17 Dec 2003 | £30,000 |
No other historical records.
8, Baysdale Gardens, Shildon DL4 2LX
| Today | See what it's worth now |
| 6 Mar 2026 | £230,000 |
| 26 May 2022 | £179,950 |
2, Princes Street, Shildon DL4 1AX

| Today | See what it's worth now |
| 3 Mar 2026 | £72,300 |
| 16 Jun 2023 | £76,000 |
19, Foundry Street, Shildon DL4 2HE
| Today | See what it's worth now |
| 16 Feb 2026 | £54,000 |
| 4 Aug 2006 | £66,500 |
4, Raven Court, Shildon DL4 2GX
| Today | See what it's worth now |
| 13 Feb 2026 | £313,200 |
| 9 Jun 2023 | £304,950 |
No other historical records.
6, Adelaide Terrace, Shildon DL4 1BE
| Today | See what it's worth now |
| 11 Feb 2026 | £70,000 |
| 8 Jun 2018 | £24,000 |
No other historical records.
Source Acknowledgement: © Crown copyright. England and Wales house price data is publicly available information produced by the HM Land Registry.This material was last updated on 9 July 2026. It covers the period from 1 January 1995 to 30 April 2026 and contains property transactions which have been registered during that period. Contains HM Land Registry data © Crown copyright and database right 2026. This data is licensed under the Open Government Licence v3.0.
Disclaimer: Rightmove.co.uk provides this HM Land Registry data "as is". The burden for fitness of the data relies completely with the user and is provided for informational purposes only. No warranty, express or implied, is given relating to the accuracy of content of the HM Land Registry data and Rightmove does not accept any liability for error or omission. If you have found an error with the data or need further information please contact HM Land Registry.
Permitted Use: Viewers of this Information are granted permission to access this Crown copyright material and to download it onto electronic, magnetic, optical or similar storage media provided that such activities are for private research, study or in-house use only. Any other use of the material requires the formal written permission of Land Registry which can be requested from us, and is subject to an additional licence and associated charge.
Rightmove takes no liability for your use of, or reliance on, Rightmove's Instant Valuation due to the limitations of our tracking tool listed here. Use of this tool is taken entirely at your own risk. All rights reserved.