
House Prices in Sidford
House prices in Sidford have an overall average of £413,128 over the last year.
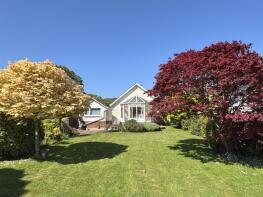
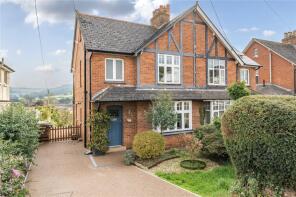
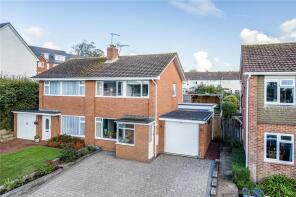
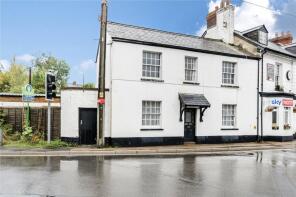
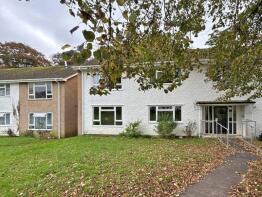
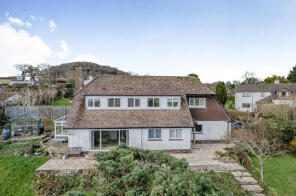
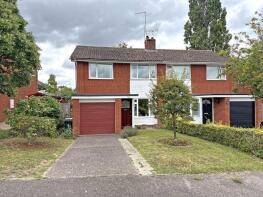
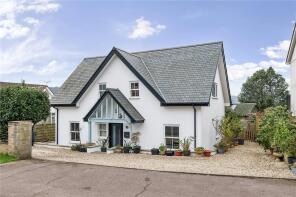
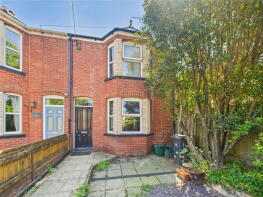
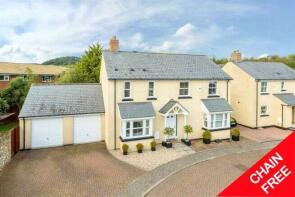
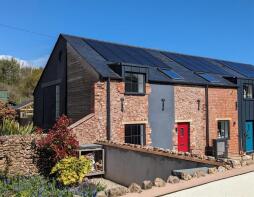
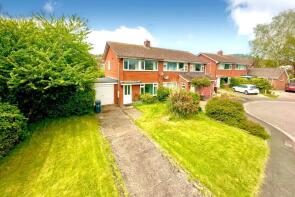
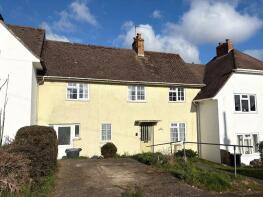
The majority of properties sold in Sidford during the last year were detached properties, selling for an average price of £536,800. Semi-detached properties sold for an average of £357,857, with terraced properties fetching £395,333.
Overall, the historical sold prices in Sidford over the last year were 3% up on the previous year and 4% down on the 2022 peak of £431,776.
Properties Sold
The Beehive, Higher Brook Meadow, Sidford EX10 9SS
| Today | See what it's worth now |
| 18 Feb 2026 | £420,000 |
No other historical records.
5, Stevens Cross Close, Sidmouth EX10 9QJ
| Today | See what it's worth now |
| 17 Feb 2026 | £520,000 |
| 31 Jul 2000 | £210,000 |
Kelso, Frys Lane, Sidmouth EX10 9SR
| Today | See what it's worth now |
| 16 Feb 2026 | £395,000 |
| 2 Feb 2018 | £340,000 |
2, Lockyer Avenue, Sidmouth EX10 9NU

| Today | See what it's worth now |
| 16 Feb 2026 | £420,000 |
| 17 Feb 2017 | £227,500 |
No other historical records.
29, Drakes Avenue, Sidmouth EX10 9JT
| Today | See what it's worth now |
| 13 Feb 2026 | £395,000 |
| 4 Oct 2019 | £275,000 |
31, Higher Brook Meadow, Sidmouth EX10 9ST

| Today | See what it's worth now |
| 3 Feb 2026 | £322,000 |
| 22 Jul 2020 | £253,750 |
No other historical records.
2b, Brook Lane, Sidmouth EX10 9PW

| Today | See what it's worth now |
| 29 Jan 2026 | £445,000 |
| 19 Jun 2017 | £320,000 |
No other historical records.
Cornerways Cottage, School Street, Sidford EX10 9PF
| Today | See what it's worth now |
| 19 Jan 2026 | £250,000 |
No other historical records.
4, Sid Vale Close, Sidmouth EX10 9PH
| Today | See what it's worth now |
| 18 Dec 2025 | £495,000 |
| 22 Oct 2020 | £375,000 |
Beaconhill, Burscombe Lane, Sidford, Sidmouth EX10 9SF
| Today | See what it's worth now |
| 16 Dec 2025 | £490,000 |
| 7 Jun 2012 | £165,000 |
Meadowbank, Coreway, Sidford, Sidmouth EX10 9SE
| Today | See what it's worth now |
| 11 Dec 2025 | £445,000 |
| 9 Oct 2001 | £176,000 |
No other historical records.
Flat 8, Vale Court, Church Street, Sidmouth EX10 9RE
| Today | See what it's worth now |
| 28 Nov 2025 | £167,000 |
| 24 Mar 1999 | £60,000 |
28, Orchard Close, Sidmouth EX10 9RF
| Today | See what it's worth now |
| 10 Nov 2025 | £159,950 |
| 11 Aug 2010 | £142,500 |
1, Old Steam Laundry, Laundry Lane, Sidford EX10 9QR
| Today | See what it's worth now |
| 21 Oct 2025 | £590,000 |
No other historical records.
Sidlaw House, Coreway, Sidford, Sidmouth EX10 9SE
| Today | See what it's worth now |
| 16 Oct 2025 | £578,000 |
No other historical records.
Apartment 2, Lockyer Lodge, South Lawn, Sidmouth EX10 9FN
| Today | See what it's worth now |
| 13 Oct 2025 | £287,500 |
| 10 Dec 2021 | £327,950 |
No other historical records.
76, Fleming Avenue, Sidmouth EX10 9NH
| Today | See what it's worth now |
| 8 Oct 2025 | £325,000 |
| 2 Sep 2003 | £165,000 |
No other historical records.
35, Sidford High Street, Sidford EX10 9SN
| Today | See what it's worth now |
| 7 Oct 2025 | £540,000 |
No other historical records.
142, Sidford Road, Sidmouth EX10 9PE
| Today | See what it's worth now |
| 6 Oct 2025 | £265,000 |
| 31 Jul 2017 | £203,000 |
13, Ballard Grove, Sidford, Sidmouth EX10 9EP
| Today | See what it's worth now |
| 11 Sep 2025 | £595,000 |
| 25 Sep 2009 | £399,000 |
No other historical records.
3, Old Steam Laundry, Laundry Lane, Sidford EX10 9QR
| Today | See what it's worth now |
| 29 Aug 2025 | £530,000 |
No other historical records.
35, Fleming Avenue, Sidmouth EX10 9NH
| Today | See what it's worth now |
| 15 Aug 2025 | £345,000 |
| 9 Nov 2007 | £230,000 |
No other historical records.
Lower Foxgrove, Coreway Close, Sidford, Sidmouth EX10 9SD
| Today | See what it's worth now |
| 13 Aug 2025 | £650,000 |
No other historical records.
Source Acknowledgement: © Crown copyright. England and Wales house price data is publicly available information produced by the HM Land Registry.This material was last updated on 9 July 2026. It covers the period from 1 January 1995 to 30 April 2026 and contains property transactions which have been registered during that period. Contains HM Land Registry data © Crown copyright and database right 2026. This data is licensed under the Open Government Licence v3.0.
Disclaimer: Rightmove.co.uk provides this HM Land Registry data "as is". The burden for fitness of the data relies completely with the user and is provided for informational purposes only. No warranty, express or implied, is given relating to the accuracy of content of the HM Land Registry data and Rightmove does not accept any liability for error or omission. If you have found an error with the data or need further information please contact HM Land Registry.
Permitted Use: Viewers of this Information are granted permission to access this Crown copyright material and to download it onto electronic, magnetic, optical or similar storage media provided that such activities are for private research, study or in-house use only. Any other use of the material requires the formal written permission of Land Registry which can be requested from us, and is subject to an additional licence and associated charge.
Rightmove takes no liability for your use of, or reliance on, Rightmove's Instant Valuation due to the limitations of our tracking tool listed here. Use of this tool is taken entirely at your own risk. All rights reserved.