
House Prices in Sissinghurst
House prices in Sissinghurst have an overall average of £502,750 over the last year.
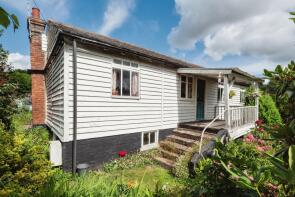
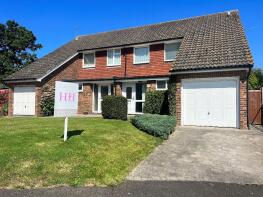
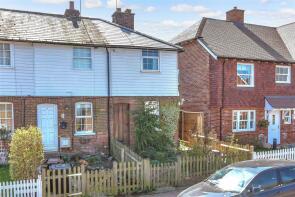
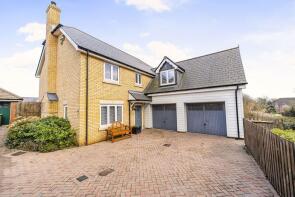
The majority of properties sold in Sissinghurst during the last year were detached properties, selling for an average price of £718,750. Semi-detached properties sold for an average of £325,833, with terraced properties fetching £391,667.
Overall, the historical sold prices in Sissinghurst over the last year were 18% down on the previous year and 20% down on the 2019 peak of £629,590.
Properties Sold
The Gallery, The Street, Sissinghurst, Cranbrook TN17 2JH

| Today | See what it's worth now |
| 9 Apr 2026 | £550,000 |
No other historical records.
Lilac House, Mill Lane, Sissinghurst, Cranbrook TN17 2HX

| Today | See what it's worth now |
| 10 Mar 2026 | £740,000 |
| 12 May 2016 | £510,000 |
2, Hawkridge Cottages, The Common, Sissinghurst, Cranbrook TN17 2AD
| Today | See what it's worth now |
| 5 Dec 2025 | £375,000 |
| 17 Jul 2018 | £325,000 |
No other historical records.
Sherwood, Wilsley Pound, Sissinghurst, Cranbrook TN17 2HR
| Today | See what it's worth now |
| 4 Dec 2025 | £600,000 |
| 18 May 2007 | £425,000 |
Rose Cottage, Common Road, Sissinghurst, Cranbrook TN17 2JR
| Today | See what it's worth now |
| 12 Nov 2025 | £280,000 |
No other historical records.
Crestway, Wilsley Pound, Sissinghurst, Cranbrook TN17 2HU
| Today | See what it's worth now |
| 10 Nov 2025 | £1,100,000 |
| 5 Sep 2013 | £565,000 |
Glen Cove, The Common, Sissinghurst, Cranbrook TN17 2AJ
| Today | See what it's worth now |
| 5 Nov 2025 | £435,000 |
No other historical records.
2 Studio Cottage, Common Road, Sissinghurst, Cranbrook TN17 2JR
| Today | See what it's worth now |
| 1 Oct 2025 | £307,500 |
| 3 May 2019 | £247,000 |
17, Hovendens, Sissinghurst, Cranbrook TN17 2LA
| Today | See what it's worth now |
| 2 Sep 2025 | £390,000 |
| 7 Jan 2002 | £142,000 |
No other historical records.
4, Olivers Cottages, The Street, Sissinghurst, Cranbrook TN17 2JQ
| Today | See what it's worth now |
| 28 Jul 2025 | £250,000 |
| 29 Apr 2022 | £267,500 |
7, Bramling Gardens, Sissinghurst, Cranbrook TN17 2DY
| Today | See what it's worth now |
| 20 Jun 2025 | £785,000 |
| 10 May 2023 | £780,000 |
19, Carpenters Meadow, Sissinghurst, Cranbrook TN17 2ER
| Today | See what it's worth now |
| 19 Jun 2025 | £1,250,000 |
No other historical records.
40, Bramling Gardens, Sissinghurst, Cranbrook TN17 2DY
| Today | See what it's worth now |
| 10 Jun 2025 | £940,000 |
| 20 Sep 2019 | £830,000 |
No other historical records.
1, St Georges Meadow, Sissinghurst, Cranbrook TN17 2EW
| Today | See what it's worth now |
| 30 May 2025 | £445,000 |
No other historical records.
17, St Georges Meadow, Sissinghurst, Cranbrook TN17 2EW
| Today | See what it's worth now |
| 27 May 2025 | £650,000 |
No other historical records.
17, Carpenters Meadow, Sissinghurst, Cranbrook TN17 2ER
| Today | See what it's worth now |
| 22 May 2025 | £1,250,000 |
No other historical records.
3, Church Mews, Sissinghurst, Cranbrook TN17 2BQ
| Today | See what it's worth now |
| 15 May 2025 | £385,000 |
| 16 Jul 2021 | £365,000 |
10, St Georges Meadow, Sissinghurst, Cranbrook TN17 2EW
| Today | See what it's worth now |
| 9 May 2025 | £430,000 |
No other historical records.
24, St Georges Meadow, Sissinghurst, Cranbrook TN17 2EW
| Today | See what it's worth now |
| 17 Apr 2025 | £435,000 |
No other historical records.
Apple Tree Cottage, Starvenden Lane, Sissinghurst, Cranbrook TN17 2AN
| Today | See what it's worth now |
| 4 Apr 2025 | £460,000 |
No other historical records.
2, Reeds Cottages, The Street, Sissinghurst, Cranbrook TN17 2JF
| Today | See what it's worth now |
| 31 Mar 2025 | £295,000 |
No other historical records.
15, St Georges Meadow, Sissinghurst, Cranbrook TN17 2EW
| Today | See what it's worth now |
| 31 Mar 2025 | £590,000 |
No other historical records.
12, Cobnut Close, Sissinghurst, Cranbrook TN17 2LD
| Today | See what it's worth now |
| 25 Mar 2025 | £675,000 |
No other historical records.
Source Acknowledgement: © Crown copyright. England and Wales house price data is publicly available information produced by the HM Land Registry.This material was last updated on 9 July 2026. It covers the period from 1 January 1995 to 30 April 2026 and contains property transactions which have been registered during that period. Contains HM Land Registry data © Crown copyright and database right 2026. This data is licensed under the Open Government Licence v3.0.
Disclaimer: Rightmove.co.uk provides this HM Land Registry data "as is". The burden for fitness of the data relies completely with the user and is provided for informational purposes only. No warranty, express or implied, is given relating to the accuracy of content of the HM Land Registry data and Rightmove does not accept any liability for error or omission. If you have found an error with the data or need further information please contact HM Land Registry.
Permitted Use: Viewers of this Information are granted permission to access this Crown copyright material and to download it onto electronic, magnetic, optical or similar storage media provided that such activities are for private research, study or in-house use only. Any other use of the material requires the formal written permission of Land Registry which can be requested from us, and is subject to an additional licence and associated charge.
Rightmove takes no liability for your use of, or reliance on, Rightmove's Instant Valuation due to the limitations of our tracking tool listed here. Use of this tool is taken entirely at your own risk. All rights reserved.