
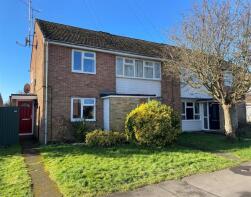
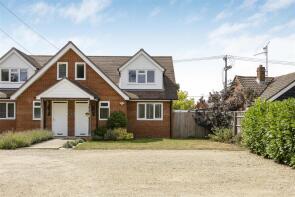
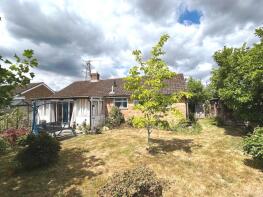
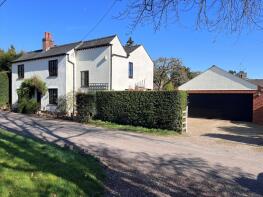
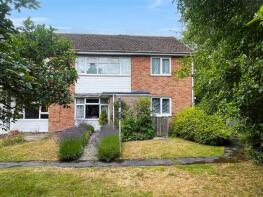
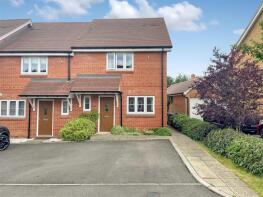
House Prices in Sonning Common
House prices in Sonning Common have an overall average of £608,556 over the last year.
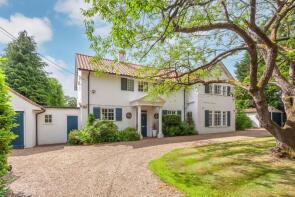
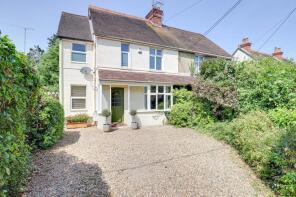
The majority of properties sold in Sonning Common during the last year were detached properties, selling for an average price of £759,500. Semi-detached properties sold for an average of £512,850, with flats fetching £266,000.
Overall, the historical sold prices in Sonning Common over the last year were 12% up on the previous year and 7% down on the 2023 peak of £653,713.
Properties Sold
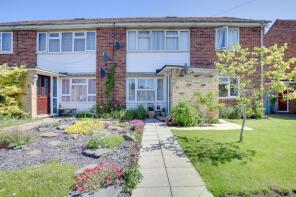
74, Lea Road, Sonning Common, Reading RG4 9LJ
| Today | See what it's worth now |
| 17 Apr 2026 | £525,000 |
| 16 Jun 2011 | £250,000 |
No other historical records.
1a, Kennylands Road, Sonning Common, Reading RG4 9JR
| Today | See what it's worth now |
| 15 Apr 2026 | £820,000 |
| 24 Mar 2022 | £860,000 |
No other historical records.
17, Sedgefield Close, Sonning Common, Reading RG4 9TS
| Today | See what it's worth now |
| 2 Apr 2026 | £485,000 |
| 8 Aug 2011 | £294,000 |
9, Shiplake Bottom, Peppard Common, Henley-on-thames RG9 5HG
| Today | See what it's worth now |
| 26 Mar 2026 | £950,000 |
| 26 Aug 2005 | £305,000 |
No other historical records.
1, Lea Road, Sonning Common, Reading RG4 9LH
| Today | See what it's worth now |
| 26 Mar 2026 | £556,000 |
| 25 Oct 2019 | £475,000 |
16, Kedge Road, Sonning Common, Reading RG4 9DQ

| Today | See what it's worth now |
| 26 Mar 2026 | £585,000 |
| 20 Dec 2019 | £505,000 |
No other historical records.
57, Lea Road, Sonning Common, Reading RG4 9LH
| Today | See what it's worth now |
| 27 Feb 2026 | £264,000 |
| 30 Jul 2018 | £265,000 |
Sunsglow, Peppard Road, Sonning Common, Reading RG4 9NJ
| Today | See what it's worth now |
| 27 Feb 2026 | £530,000 |
| 16 Nov 2022 | £470,000 |
No other historical records.
Whitehill, Reades Lane, Sonning Common, Reading RG4 9LL
| Today | See what it's worth now |
| 20 Feb 2026 | £1,135,000 |
No other historical records.
20, Grove Road, Sonning Common, Reading RG4 9RL
| Today | See what it's worth now |
| 19 Feb 2026 | £565,000 |
| 14 Jan 2015 | £415,000 |
9, Chiltern Bank, Peppard Common, Henley-on-thames RG9 5HU
| Today | See what it's worth now |
| 4 Feb 2026 | £475,000 |
No other historical records.
9, Heatherfield Place, Sonning Common, Reading RG4 9EQ
| Today | See what it's worth now |
| 23 Jan 2026 | £800,000 |
| 23 Dec 2019 | £685,000 |
No other historical records.
4, Westleigh Drive, Sonning Common, Reading RG4 9LB
| Today | See what it's worth now |
| 9 Jan 2026 | £592,500 |
| 9 Nov 2010 | £376,000 |
10, Old Copse Gardens, Sonning Common, Reading RG4 9TH
| Today | See what it's worth now |
| 17 Dec 2025 | £550,000 |
| 19 Jun 2020 | £474,490 |
43 Thurleston, Kennylands Road, Sonning Common, Reading RG4 9JR
| Today | See what it's worth now |
| 16 Dec 2025 | £1,200,000 |
| 24 May 1996 | £166,000 |
No other historical records.
23, Kedge Road, Sonning Common, Reading RG4 9DQ
| Today | See what it's worth now |
| 1 Dec 2025 | £548,000 |
| 15 Dec 2020 | £495,000 |
No other historical records.
2, Pages Orchard, Sonning Common, Reading RG4 9LW
| Today | See what it's worth now |
| 28 Nov 2025 | £480,000 |
| 20 May 2014 | £295,000 |
18, Newfield Road, Sonning Common, Reading RG4 9TB
| Today | See what it's worth now |
| 27 Nov 2025 | £700,000 |
No other historical records.
36, Westleigh Drive, Sonning Common, Reading RG4 9LB
| Today | See what it's worth now |
| 17 Nov 2025 | £500,000 |
| 12 Apr 2006 | £270,000 |
No other historical records.
Rose Cottage, The Hamlet, Gallowstree Common, Reading RG4 9BU
| Today | See what it's worth now |
| 17 Nov 2025 | £970,000 |
| 21 Jun 2001 | £328,000 |
52, Lea Road, Sonning Common, Reading RG4 9LJ
| Today | See what it's worth now |
| 31 Oct 2025 | £275,000 |
| 29 Jun 2017 | £275,000 |
25, Bay Tree Rise, Sonning Common, Reading RG4 9DB
| Today | See what it's worth now |
| 21 Oct 2025 | £400,000 |
| 20 Dec 2018 | £365,000 |
No other historical records.
68, Lea Road, Sonning Common, Reading RG4 9LJ
| Today | See what it's worth now |
| 13 Oct 2025 | £260,000 |
| 11 May 2018 | £275,000 |
Source Acknowledgement: © Crown copyright. England and Wales house price data is publicly available information produced by the HM Land Registry.This material was last updated on 9 July 2026. It covers the period from 1 January 1995 to 30 April 2026 and contains property transactions which have been registered during that period. Contains HM Land Registry data © Crown copyright and database right 2026. This data is licensed under the Open Government Licence v3.0.
Disclaimer: Rightmove.co.uk provides this HM Land Registry data "as is". The burden for fitness of the data relies completely with the user and is provided for informational purposes only. No warranty, express or implied, is given relating to the accuracy of content of the HM Land Registry data and Rightmove does not accept any liability for error or omission. If you have found an error with the data or need further information please contact HM Land Registry.
Permitted Use: Viewers of this Information are granted permission to access this Crown copyright material and to download it onto electronic, magnetic, optical or similar storage media provided that such activities are for private research, study or in-house use only. Any other use of the material requires the formal written permission of Land Registry which can be requested from us, and is subject to an additional licence and associated charge.
Rightmove takes no liability for your use of, or reliance on, Rightmove's Instant Valuation due to the limitations of our tracking tool listed here. Use of this tool is taken entirely at your own risk. All rights reserved.