
House Prices in South Bank
House prices in South Bank have an overall average of £363,059 over the last year.
The majority of properties sold in South Bank during the last year were terraced properties, selling for an average price of £378,563. Flats sold for an average of £262,676, with semi-detached properties fetching £452,429.
Overall, the historical sold prices in South Bank over the last year were 6% down on the previous year and 10% down on the 2022 peak of £402,979.
Properties Sold
9, Finsbury Street, York YO23 1LT
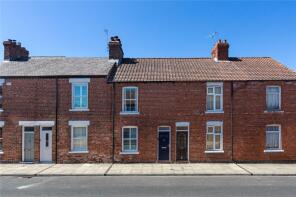
| Today | See today's value |
| 6 Aug 2026 | £337,000 |
| 11 Dec 2020 | £275,000 |
7, Adelaide Street, York YO23 1DL
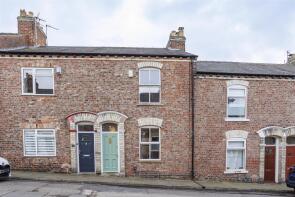
| Today | See today's value |
| 5 Aug 2026 | £375,000 |
| 1 Nov 2016 | £249,950 |
12, Colenso Street, York YO23 1AS
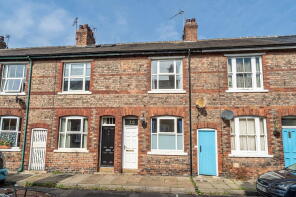
| Today | See today's value |
| 3 Aug 2026 | £325,000 |
| 29 Oct 2024 | £325,000 |
14, Westwood Terrace, York YO23 1HL
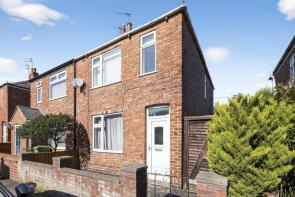
| Today | See today's value |
| 31 Jul 2026 | £247,000 |
| 8 Dec 2009 | £162,000 |
18, Dove Street, York YO23 1AQ
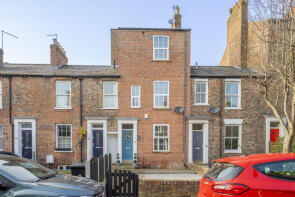
| Today | See today's value |
| 31 Jul 2026 | £450,000 |
| 4 Jun 1999 | £75,000 |
No other historical records.
81, Thorpe Street, York YO23 1NJ
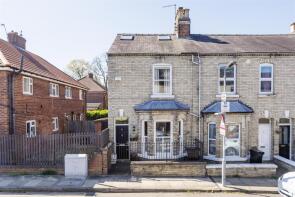
| Today | See today's value |
| 31 Jul 2026 | £445,000 |
| 16 Aug 2010 | £215,000 |
60, Westwood Terrace, York YO23 1HL
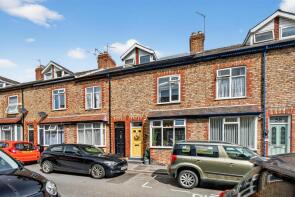
| Today | See today's value |
| 29 Jul 2026 | £395,000 |
| 30 Nov 2018 | £249,000 |
35, Brunswick Street, York YO23 1EB

| Today | See today's value |
| 24 Jul 2026 | £225,000 |
| 19 Jan 2015 | £153,500 |
13, Gray Street, York YO23 1BN
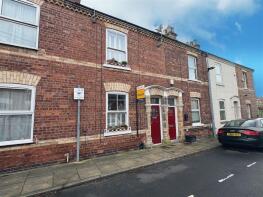
| Today | See today's value |
| 17 Jul 2026 | £345,000 |
| 8 Nov 2021 | £320,000 |
12, Mill Mount Lodge, Mill Mount, York YO24 1BG
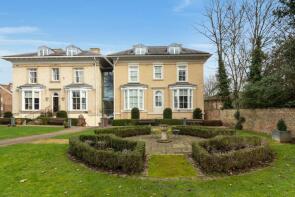
| Today | See today's value |
| 15 Jul 2026 | £233,000 |
| 28 Jul 2014 | £230,000 |
10, Southlands Road, York YO23 1NP

| Today | See today's value |
| 9 Jul 2026 | £800,000 |
| 20 May 2022 | £663,000 |
39, Westwood Terrace, York YO23 1HJ
| Today | See today's value |
| 7 Jul 2026 | £240,000 |
| 16 May 2002 | £90,000 |
3, Bayldon House, Joseph Terry Grove, York YO23 1PZ
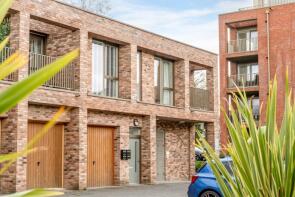
| Today | See today's value |
| 26 Jun 2026 | £165,000 |
| 29 May 2020 | £176,000 |
6, Moss Street, York YO23 1BR
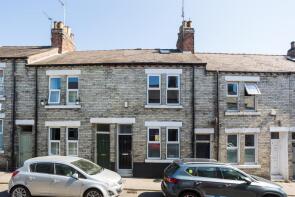
| Today | See today's value |
| 26 Jun 2026 | £390,200 |
| 25 Feb 2021 | £330,000 |
67, Kensington Street, York YO23 1JA
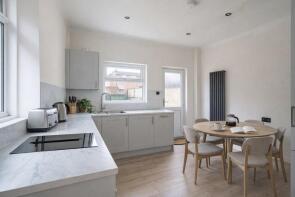
| Today | See today's value |
| 26 Jun 2026 | £250,000 |
| 30 Oct 2024 | £185,000 |
Apartment 110, The Residence, Bishopthorpe Road, York YO23 1DQ
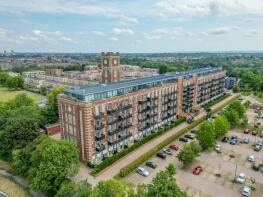
| Today | See today's value |
| 23 Jun 2026 | £210,000 |
| 31 May 2017 | £209,950 |
No other historical records.
3, Thistle House, Joseph Terry Grove, York YO23 1FP

| Today | See today's value |
| 23 Jun 2026 | £300,000 |
| 16 Dec 2021 | £310,000 |
No other historical records.
143, Albemarle Road, York YO23 1HD

| Today | See today's value |
| 22 Jun 2026 | £385,000 |
| 15 Dec 2017 | £355,000 |
63, Nunmill Street, York YO23 1NT
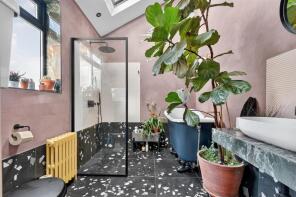
| Today | See today's value |
| 22 Jun 2026 | £462,000 |
| 7 Apr 2021 | £333,000 |
5, Colenso Street, York YO23 1AS
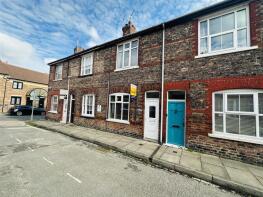
| Today | See today's value |
| 15 Jun 2026 | £310,000 |
| 4 Jun 2018 | £215,000 |
No other historical records.
19, Finsbury Street, York YO23 1LT
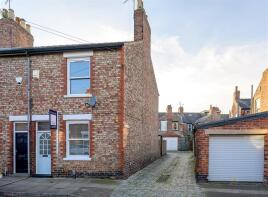
| Today | See today's value |
| 12 Jun 2026 | £265,600 |
| 27 Nov 2000 | £72,500 |
32, Jamieson Terrace, York YO23 1HF

| Today | See today's value |
| 12 Jun 2026 | £416,000 |
| 17 Mar 2016 | £208,100 |
No other historical records.
56, Russell Street, York YO23 1NW

| Today | See today's value |
| 12 Jun 2026 | £385,000 |
| 29 Aug 2023 | £386,000 |
No other historical records.
Rightmove takes no liability for your use of, or reliance on, Rightmove's Instant Valuation due to the limitations of our tracking tool listed here. Use of this tool is taken entirely at your own risk. All rights reserved.