
House Prices in South Claines
House prices in South Claines have an overall average of £327,281 over the last year.
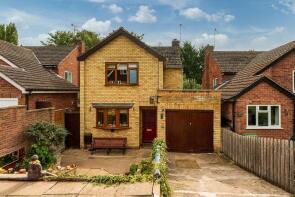
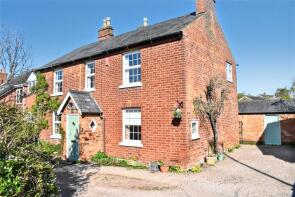
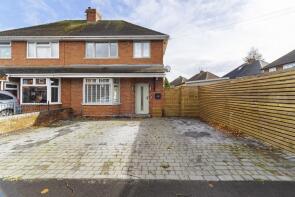
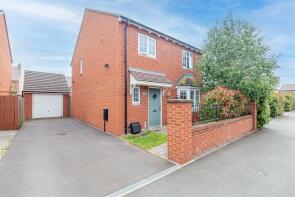
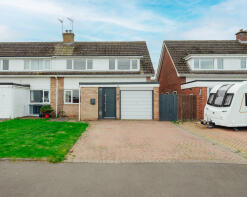
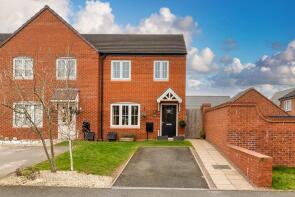
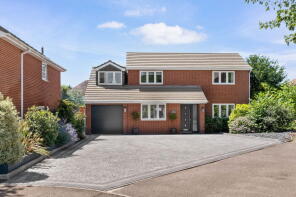
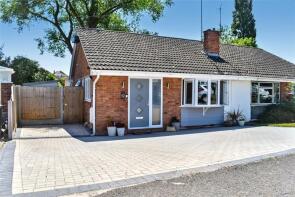
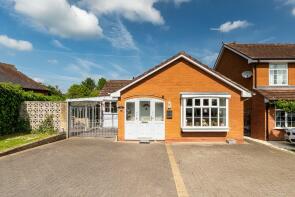
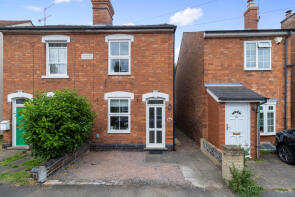
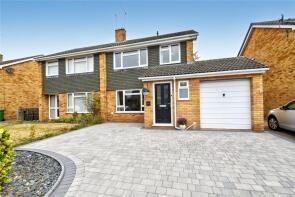
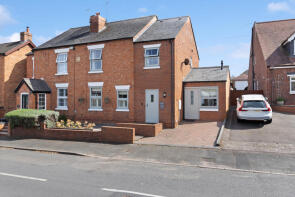
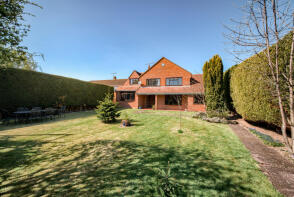
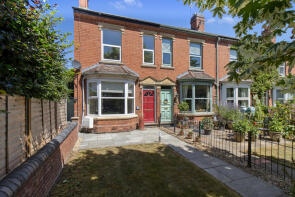
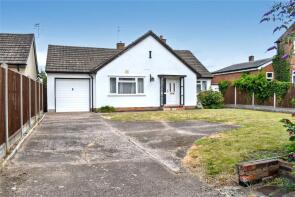
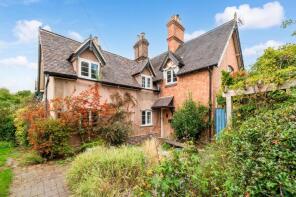
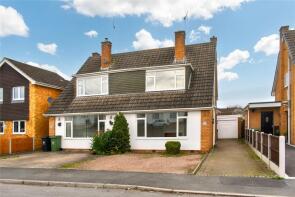
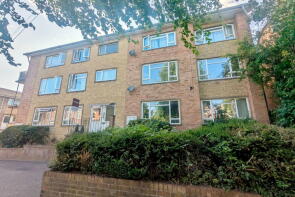
The majority of properties sold in South Claines during the last year were semi-detached properties, selling for an average price of £310,263. Detached properties sold for an average of £469,664, with terraced properties fetching £314,697.
Overall, the historical sold prices in South Claines over the last year were 5% down on the previous year and 8% down on the 2022 peak of £353,889.
Properties Sold
3, Tower Road, Worcester WR3 7AF
| Today | See what it's worth now |
| 13 Mar 2026 | £355,000 |
| 29 May 2008 | £238,000 |
No other historical records.
222, Droitwich Road, Worcester WR3 7UA
| Today | See what it's worth now |
| 12 Mar 2026 | £561,750 |
| 11 Jun 2007 | £369,000 |
2, Morrin Close, Worcester WR3 7PF
| Today | See what it's worth now |
| 11 Mar 2026 | £320,000 |
| 26 Feb 2021 | £205,000 |
No other historical records.
43, Ivy Crescent, Bevere, Worcester WR3 7DP
| Today | See what it's worth now |
| 11 Mar 2026 | £380,000 |
| 30 Jun 2016 | £281,995 |
No other historical records.
43, Shrawley Road, Worcester WR3 7XD
| Today | See what it's worth now |
| 4 Mar 2026 | £331,000 |
| 1 Oct 2021 | £278,000 |
3, Perdiswell Street, Worcester WR3 7HZ

| Today | See what it's worth now |
| 27 Feb 2026 | £212,000 |
| 24 Oct 2016 | £158,000 |
21, Shrawley Road, Worcester WR3 7TW
| Today | See what it's worth now |
| 26 Feb 2026 | £527,000 |
| 28 Sep 2021 | £300,000 |
4, Hazel Croft, Bevere, Worcester WR3 7ER
| Today | See what it's worth now |
| 13 Feb 2026 | £210,000 |
| 25 Nov 2016 | £141,050 |
No other historical records.
Apartment 12, Eastbank Court, Eastbank Drive, Worcester WR3 7EW
| Today | See what it's worth now |
| 6 Feb 2026 | £155,000 |
| 16 Mar 2012 | £197,500 |
No other historical records.
51, Meadow Road, Worcester WR3 7PP
| Today | See what it's worth now |
| 2 Feb 2026 | £495,000 |
| 29 Jan 2021 | £398,000 |
52, Leabank Drive, Worcester WR3 7QZ
| Today | See what it's worth now |
| 29 Jan 2026 | £274,000 |
| 20 Jul 2020 | £158,000 |
No other historical records.
15, Sky Court, Worcester WR3 7QJ
| Today | See what it's worth now |
| 23 Jan 2026 | £135,000 |
| 14 Dec 2007 | £142,000 |
No other historical records.
57, St Annes Road, Worcester WR3 7PQ
| Today | See what it's worth now |
| 9 Jan 2026 | £287,000 |
| 23 Jan 2015 | £180,000 |
No other historical records.
28, The Drive, Worcester WR3 7JS
| Today | See what it's worth now |
| 19 Dec 2025 | £240,000 |
| 21 Jul 2023 | £218,000 |
31, Willowslea Road, Worcester WR3 7QP
| Today | See what it's worth now |
| 18 Dec 2025 | £360,000 |
| 31 Oct 2013 | £168,000 |
No other historical records.
48, Station Road, Fernhill Heath WR3 7UP
| Today | See what it's worth now |
| 18 Dec 2025 | £422,500 |
No other historical records.
Flat 2a, Bevere House, Bevere Green, Worcester WR3 7RG
| Today | See what it's worth now |
| 18 Dec 2025 | £184,500 |
| 29 Sep 2021 | £170,000 |
Flat 6, Pinewood House, Coombs Road, Worcester WR3 7HW
| Today | See what it's worth now |
| 17 Dec 2025 | £130,000 |
| 9 Jan 2020 | £115,000 |
289, Droitwich Road, Claines, Worcester WR3 7SW
| Today | See what it's worth now |
| 17 Dec 2025 | £610,000 |
| 6 Nov 2015 | £359,950 |
375, Ombersley Road, Worcester WR3 7DA

| Today | See what it's worth now |
| 16 Dec 2025 | £416,000 |
| 24 Nov 2016 | £315,000 |
62, Lavender Road, Worcester WR3 7AE
| Today | See what it's worth now |
| 15 Dec 2025 | £378,000 |
| 3 Dec 2018 | £255,000 |
No other historical records.
240, Ombersley Road, Worcester WR3 7HB
| Today | See what it's worth now |
| 10 Dec 2025 | £260,000 |
| 21 Dec 2000 | £90,000 |
No other historical records.
The Grange Cottage, Danes Green, Claines WR3 7RS
| Today | See what it's worth now |
| 8 Dec 2025 | £261,000 |
No other historical records.
Source Acknowledgement: © Crown copyright. England and Wales house price data is publicly available information produced by the HM Land Registry.This material was last updated on 15 May 2026. It covers the period from 1 January 1995 to 31 March 2026 and contains property transactions which have been registered during that period. Contains HM Land Registry data © Crown copyright and database right 2026. This data is licensed under the Open Government Licence v3.0.
Disclaimer: Rightmove.co.uk provides this HM Land Registry data "as is". The burden for fitness of the data relies completely with the user and is provided for informational purposes only. No warranty, express or implied, is given relating to the accuracy of content of the HM Land Registry data and Rightmove does not accept any liability for error or omission. If you have found an error with the data or need further information please contact HM Land Registry.
Permitted Use: Viewers of this Information are granted permission to access this Crown copyright material and to download it onto electronic, magnetic, optical or similar storage media provided that such activities are for private research, study or in-house use only. Any other use of the material requires the formal written permission of Land Registry which can be requested from us, and is subject to an additional licence and associated charge.
Map data ©OpenStreetMap contributors.
Rightmove takes no liability for your use of, or reliance on, Rightmove's Instant Valuation due to the limitations of our tracking tool listed here. Use of this tool is taken entirely at your own risk. All rights reserved.