
House Prices in South Killingholme
House prices in South Killingholme have an overall average of £133,125 over the last year.
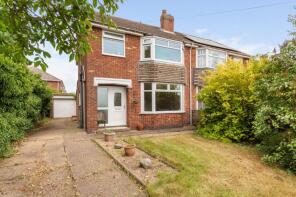
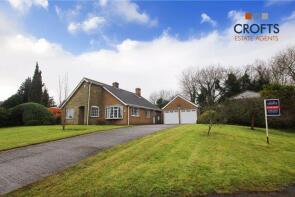
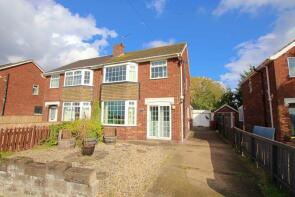
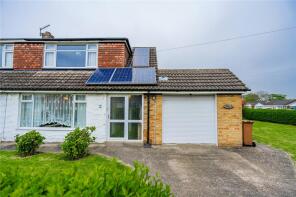
The majority of properties sold in South Killingholme during the last year were semi-detached properties, selling for an average price of £120,167. Detached properties sold for an average of £172,000.
Overall, the historical sold prices in South Killingholme over the last year were 2% down on the previous year and 6% down on the 2023 peak of £141,677.
Properties Sold
1, Habrough Court, Immingham DN40 3HZ
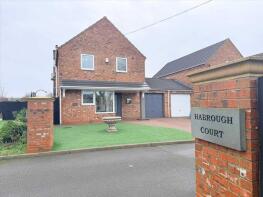
| Today | See what it's worth now |
| 30 Mar 2026 | £220,000 |
| 31 Jan 2024 | £180,000 |
22, Hawkins Way, Immingham DN40 3HQ
| Today | See what it's worth now |
| 23 Mar 2026 | £139,000 |
| 13 Oct 2016 | £92,000 |
19, St Denys Close, Immingham DN40 3EY
| Today | See what it's worth now |
| 27 Feb 2026 | £110,000 |
| 5 Dec 2001 | £21,000 |
No other historical records.
43, School Road, Immingham DN40 3HS
| Today | See what it's worth now |
| 15 Jan 2026 | £146,000 |
| 15 Nov 2019 | £95,000 |
16, Top Road, South Killingholme DN40 3JD
| Today | See what it's worth now |
| 4 Nov 2025 | £90,000 |
No other historical records.
41, Pilgrims Close, South Killingholme DN40 3HU
| Today | See what it's worth now |
| 23 Oct 2025 | £105,000 |
No other historical records.
6, Mayfield Avenue, Immingham DN40 3DF

| Today | See what it's worth now |
| 15 Sep 2025 | £50,000 |
| 9 Oct 1995 | £19,000 |
No other historical records.
6, Primitive Chapel Lane, Immingham DN40 3BU
| Today | See what it's worth now |
| 2 Sep 2025 | £205,000 |
| 4 Jan 2001 | £66,500 |
No other historical records.
11, Lancaster Drive, Immingham DN40 3HL
| Today | See what it's worth now |
| 25 Jul 2025 | £135,000 |
| 31 Aug 2007 | £120,000 |
No other historical records.
10, Top Road, Immingham DN40 3JD
| Today | See what it's worth now |
| 10 Jul 2025 | £132,000 |
| 31 Jul 2020 | £135,000 |
No other historical records.
6, Lancaster Drive, South Killingholme DN40 3HL
| Today | See what it's worth now |
| 27 Feb 2025 | £127,000 |
No other historical records.
7, Lancaster Drive, Immingham DN40 3HL
| Today | See what it's worth now |
| 20 Feb 2025 | £167,500 |
| 19 Mar 2012 | £98,500 |
37, St Denys Close, Immingham DN40 3EY
| Today | See what it's worth now |
| 19 Feb 2025 | £86,000 |
| 19 Dec 2007 | £22,000 |
1, Hewitts Row, Moat Lane, Immingham DN40 3ET
| Today | See what it's worth now |
| 5 Feb 2025 | £76,000 |
| 22 Sep 2010 | £314,700 |
2, Mayflower Close, South Killingholme DN40 3HF
| Today | See what it's worth now |
| 11 Dec 2024 | £120,000 |
No other historical records.
8, Wellington Close, Immingham DN40 3HN
| Today | See what it's worth now |
| 21 Nov 2024 | £157,000 |
| 10 Jul 2023 | £152,500 |
Iona, Town Street, South Killingholme DN40 3EP

| Today | See what it's worth now |
| 15 Nov 2024 | £150,000 |
No other historical records.
1, Wellington Close, Immingham DN40 3HN
| Today | See what it's worth now |
| 31 Oct 2024 | £133,000 |
| 29 Sep 2011 | £110,000 |
Summergate House, Moat Lane, Immingham DN40 3EU
| Today | See what it's worth now |
| 13 Sep 2024 | £145,000 |
| 18 Apr 2019 | £115,000 |
No other historical records.
30, Top Road, South Killingholme DN40 3JF
| Today | See what it's worth now |
| 11 Sep 2024 | £115,000 |
No other historical records.
12, Lancaster Drive, Immingham DN40 3HL

| Today | See what it's worth now |
| 16 Aug 2024 | £154,000 |
| 5 May 2022 | £144,950 |
No other historical records.
9, Mayflower Close, Immingham DN40 3HG
| Today | See what it's worth now |
| 15 Aug 2024 | £130,000 |
| 16 Jul 2021 | £89,000 |
4, Lancaster Drive, Immingham DN40 3HL
| Today | See what it's worth now |
| 19 Jul 2024 | £141,750 |
| 3 Feb 2014 | £103,000 |
No other historical records.

Source Acknowledgement: © Crown copyright. England and Wales house price data is publicly available information produced by the HM Land Registry.This material was last updated on 9 July 2026. It covers the period from 1 January 1995 to 30 April 2026 and contains property transactions which have been registered during that period. Contains HM Land Registry data © Crown copyright and database right 2026. This data is licensed under the Open Government Licence v3.0.
Disclaimer: Rightmove.co.uk provides this HM Land Registry data "as is". The burden for fitness of the data relies completely with the user and is provided for informational purposes only. No warranty, express or implied, is given relating to the accuracy of content of the HM Land Registry data and Rightmove does not accept any liability for error or omission. If you have found an error with the data or need further information please contact HM Land Registry.
Permitted Use: Viewers of this Information are granted permission to access this Crown copyright material and to download it onto electronic, magnetic, optical or similar storage media provided that such activities are for private research, study or in-house use only. Any other use of the material requires the formal written permission of Land Registry which can be requested from us, and is subject to an additional licence and associated charge.
Rightmove takes no liability for your use of, or reliance on, Rightmove's Instant Valuation due to the limitations of our tracking tool listed here. Use of this tool is taken entirely at your own risk. All rights reserved.