
House Prices in South Rauceby
House prices in South Rauceby have an overall average of £285,550 over the last year.
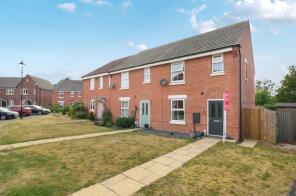
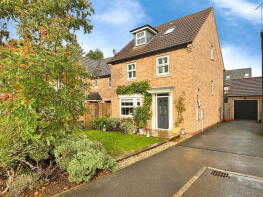
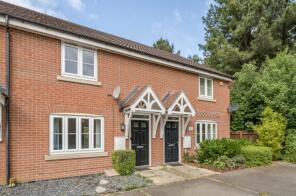
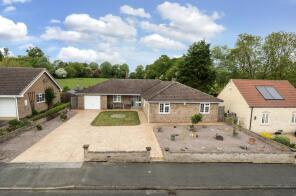
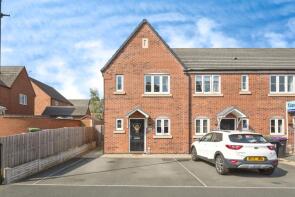
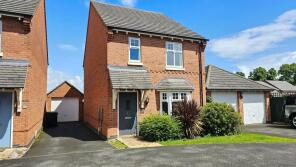
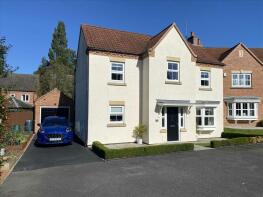
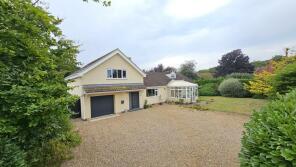
The majority of properties sold in South Rauceby during the last year were detached properties, selling for an average price of £448,750. Semi-detached properties sold for an average of £159,750, with terraced properties fetching £84,950.
Overall, the historical sold prices in South Rauceby over the last year were 9% down on the previous year and 25% down on the 2022 peak of £380,547.
Properties Sold
96, Glengarry Way, Greylees, Sleaford NG34 8XU
| Today | See what it's worth now |
| 31 Mar 2026 | £92,000 |
| 7 Nov 2011 | £58,500 |
No other historical records.
7, Troon Court, Greylees, Sleaford NG34 8GU
| Today | See what it's worth now |
| 27 Feb 2026 | £315,000 |
| 13 May 2016 | £230,000 |
38, Murrayfield Avenue, Greylees, Sleaford NG34 8GP
| Today | See what it's worth now |
| 19 Dec 2025 | £84,950 |
| 14 Apr 2021 | £75,000 |
No other historical records.
8, Chapel Close, South Rauceby, Sleaford NG34 8QZ
| Today | See what it's worth now |
| 17 Dec 2025 | £475,000 |
| 19 Jun 2008 | £250,000 |
No other historical records.
14, Murrayfield Avenue, Greylees, Sleaford NG34 8GP
| Today | See what it's worth now |
| 17 Dec 2025 | £325,000 |
| 23 Jun 2017 | £235,000 |
30, Main Street, South Rauceby, Sleaford NG34 8QG
| Today | See what it's worth now |
| 31 Oct 2025 | £680,000 |
| 22 Mar 2021 | £395,000 |
46, Murrayfield Avenue, Greylees, Sleaford NG34 8GP
| Today | See what it's worth now |
| 6 Oct 2025 | £84,950 |
| 10 Jun 2022 | £75,000 |
64, Murrayfield Avenue, Greylees, Sleaford NG34 8GP
| Today | See what it's worth now |
| 25 Jul 2025 | £227,500 |
| 13 Jul 2021 | £200,000 |
6, Troon Court, Greylees, Sleaford NG34 8GU

| Today | See what it's worth now |
| 31 Mar 2025 | £300,000 |
| 26 Nov 2010 | £228,686 |
No other historical records.
72, Glengarry Way, Greylees, Sleaford NG34 8XU
| Today | See what it's worth now |
| 27 Mar 2025 | £175,000 |
| 14 Dec 2018 | £158,495 |
No other historical records.
15, Murrayfield Avenue, Greylees, Sleaford NG34 8GP

| Today | See what it's worth now |
| 7 Mar 2025 | £420,000 |
| 17 Jun 2016 | £265,000 |
80a Cargan House, Murrayfield Avenue, Greylees, Sleaford NG34 8GP
| Today | See what it's worth now |
| 5 Mar 2025 | £225,000 |
| 9 May 2019 | £192,000 |
25, Kinross Road, Greylees, Sleaford NG34 8GB
| Today | See what it's worth now |
| 14 Feb 2025 | £354,000 |
| 28 Apr 2006 | £225,995 |
No other historical records.
28, Pinfold Lane, South Rauceby, Sleaford NG34 8QE
| Today | See what it's worth now |
| 14 Feb 2025 | £640,000 |
| 19 Aug 2009 | £300,000 |
7, Turnberry Close, Greylees, Sleaford NG34 8GW
| Today | See what it's worth now |
| 17 Dec 2024 | £425,000 |
| 28 Nov 2016 | £266,000 |
76, Glengarry Way, Greylees, Sleaford NG34 8XU
| Today | See what it's worth now |
| 9 Dec 2024 | £150,000 |
| 12 Feb 2021 | £156,000 |
4, Roxburgh Drive, Greylees, Sleaford NG34 8XW
| Today | See what it's worth now |
| 21 Aug 2024 | £250,000 |
| 13 Dec 2018 | £224,995 |
No other historical records.
22, Gleneagles Drive, Greylees, Sleaford NG34 8GH
| Today | See what it's worth now |
| 16 Aug 2024 | £250,000 |
| 4 Jun 2021 | £190,000 |
11, Murrayfield Avenue, Greylees, Sleaford NG34 8GP
| Today | See what it's worth now |
| 16 Aug 2024 | £320,000 |
| 1 Oct 2015 | £220,000 |
40, Murrayfield Avenue, Greylees, Sleaford NG34 8GP

| Today | See what it's worth now |
| 30 Jul 2024 | £90,000 |
No other historical records.
6, Gleneagles Drive, Greylees, Sleaford NG34 8GH

| Today | See what it's worth now |
| 4 Jun 2024 | £500,000 |
| 28 Sep 2007 | £392,995 |
No other historical records.
28, Gleneagles Drive, Greylees, Sleaford NG34 8GH
| Today | See what it's worth now |
| 16 Apr 2024 | £290,000 |
| 15 Jul 2016 | £233,000 |
1, Turnberry Close, Greylees, Sleaford NG34 8GW

| Today | See what it's worth now |
| 22 Mar 2024 | £142,500 |
No other historical records.
Source Acknowledgement: © Crown copyright. England and Wales house price data is publicly available information produced by the HM Land Registry.This material was last updated on 9 July 2026. It covers the period from 1 January 1995 to 30 April 2026 and contains property transactions which have been registered during that period. Contains HM Land Registry data © Crown copyright and database right 2026. This data is licensed under the Open Government Licence v3.0.
Disclaimer: Rightmove.co.uk provides this HM Land Registry data "as is". The burden for fitness of the data relies completely with the user and is provided for informational purposes only. No warranty, express or implied, is given relating to the accuracy of content of the HM Land Registry data and Rightmove does not accept any liability for error or omission. If you have found an error with the data or need further information please contact HM Land Registry.
Permitted Use: Viewers of this Information are granted permission to access this Crown copyright material and to download it onto electronic, magnetic, optical or similar storage media provided that such activities are for private research, study or in-house use only. Any other use of the material requires the formal written permission of Land Registry which can be requested from us, and is subject to an additional licence and associated charge.
Rightmove takes no liability for your use of, or reliance on, Rightmove's Instant Valuation due to the limitations of our tracking tool listed here. Use of this tool is taken entirely at your own risk. All rights reserved.