
House Prices in South View
House prices in South View have an overall average of £320,212 over the last year.
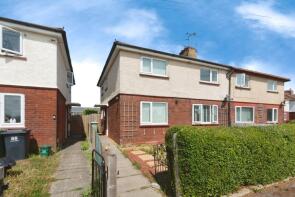
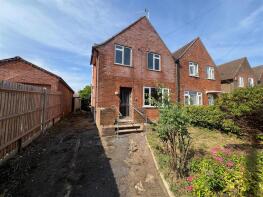
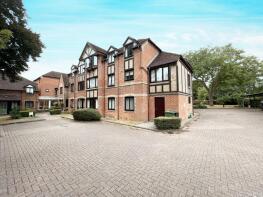
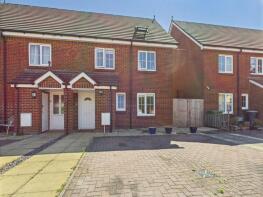
The majority of properties sold in South View during the last year were semi-detached properties, selling for an average price of £411,435. Terraced properties sold for an average of £293,333, with flats fetching £182,500.
Overall, the historical sold prices in South View over the last year were 3% down on the previous year and similar to the 2023 peak of £317,946.
Properties Sold
14, Bennet Close, Basingstoke RG21 5JR
| Today | See what it's worth now |
| 11 Mar 2026 | £253,000 |
| 6 Jan 2006 | £128,500 |
No other historical records.
59, Gregory Close, Basingstoke RG21 5LF
| Today | See what it's worth now |
| 6 Mar 2026 | £312,500 |
| 3 Aug 2007 | £174,500 |
53, Forsythia Walk, Basingstoke RG21 5RL
| Today | See what it's worth now |
| 6 Feb 2026 | £195,000 |
| 9 Feb 2007 | £145,000 |
No other historical records.
44, Oakridge Road, Basingstoke RG21 5SJ

| Today | See what it's worth now |
| 4 Feb 2026 | £372,500 |
No other historical records.
40, Coleman Close, Basingstoke RG21 5LD
| Today | See what it's worth now |
| 2 Feb 2026 | £265,000 |
| 22 Oct 2004 | £142,000 |
No other historical records.
66, Merton Road, Basingstoke RG21 5UB
| Today | See what it's worth now |
| 29 Jan 2026 | £368,000 |
| 19 Aug 2019 | £290,000 |
36, Lancaster Road, Basingstoke RG21 5UE
| Today | See what it's worth now |
| 26 Jan 2026 | £314,220 |
No other historical records.
4, Sylvaner Court, Vyne Road, Basingstoke RG21 5NZ
| Today | See what it's worth now |
| 23 Jan 2026 | £130,000 |
| 9 Nov 2017 | £160,000 |
34, Baynard Close, Basingstoke RG21 5LP
| Today | See what it's worth now |
| 22 Jan 2026 | £400,000 |
No other historical records.
21, Burgess Road, Basingstoke RG21 5NP
| Today | See what it's worth now |
| 17 Dec 2025 | £680,000 |
| 25 Feb 2014 | £395,000 |
41, Burgess Road, Basingstoke RG21 5NP
| Today | See what it's worth now |
| 4 Dec 2025 | £475,000 |
| 5 Jun 2020 | £405,000 |
5, Nash Close, Basingstoke RG21 5NH
| Today | See what it's worth now |
| 27 Nov 2025 | £275,000 |
| 18 Aug 2017 | £242,000 |
32, Hillary Road, Basingstoke RG21 5TN
| Today | See what it's worth now |
| 25 Nov 2025 | £415,000 |
| 20 Dec 2017 | £324,000 |
13, Soper Grove, Basingstoke RG21 5PU

| Today | See what it's worth now |
| 7 Nov 2025 | £340,000 |
| 12 Nov 2015 | £220,000 |
20, Shooters Way, Basingstoke RG21 5PP
| Today | See what it's worth now |
| 13 Oct 2025 | £425,000 |
| 8 Jul 2013 | £249,000 |
104, Mullins Close, Basingstoke RG21 5QZ
| Today | See what it's worth now |
| 10 Oct 2025 | £315,000 |
| 27 Oct 2017 | £250,000 |
41, Baynard Close, Basingstoke RG21 5LP
| Today | See what it's worth now |
| 3 Oct 2025 | £230,000 |
No other historical records.
69, Millard Close, Basingstoke RG21 5TX
| Today | See what it's worth now |
| 2 Oct 2025 | £195,000 |
| 4 Mar 2011 | £145,000 |
20, Sylvaner Court, Vyne Road, Basingstoke RG21 5NZ

| Today | See what it's worth now |
| 30 Sep 2025 | £165,000 |
| 1 Feb 2019 | £210,000 |
No other historical records.
2, Oakridge Road, Basingstoke RG21 5RR
| Today | See what it's worth now |
| 26 Sep 2025 | £445,000 |
| 28 Jun 2002 | £128,000 |
No other historical records.
7, Darlington House, Darlington Road, Basingstoke RG21 5AD
| Today | See what it's worth now |
| 26 Sep 2025 | £275,000 |
| 20 Jan 2023 | £220,000 |
5, Kingfisher Court, Kingsclere Road, Basingstoke RG21 5UJ
| Today | See what it's worth now |
| 16 Sep 2025 | £157,000 |
| 10 Feb 2022 | £155,000 |
No other historical records.
2, Arlott Drive, Basingstoke RG21 5GU
| Today | See what it's worth now |
| 29 Aug 2025 | £220,000 |
| 24 Oct 2008 | £125,000 |
Source Acknowledgement: © Crown copyright. England and Wales house price data is publicly available information produced by the HM Land Registry.This material was last updated on 15 May 2026. It covers the period from 1 January 1995 to 31 March 2026 and contains property transactions which have been registered during that period. Contains HM Land Registry data © Crown copyright and database right 2026. This data is licensed under the Open Government Licence v3.0.
Disclaimer: Rightmove.co.uk provides this HM Land Registry data "as is". The burden for fitness of the data relies completely with the user and is provided for informational purposes only. No warranty, express or implied, is given relating to the accuracy of content of the HM Land Registry data and Rightmove does not accept any liability for error or omission. If you have found an error with the data or need further information please contact HM Land Registry.
Permitted Use: Viewers of this Information are granted permission to access this Crown copyright material and to download it onto electronic, magnetic, optical or similar storage media provided that such activities are for private research, study or in-house use only. Any other use of the material requires the formal written permission of Land Registry which can be requested from us, and is subject to an additional licence and associated charge.
Rightmove takes no liability for your use of, or reliance on, Rightmove's Instant Valuation due to the limitations of our tracking tool listed here. Use of this tool is taken entirely at your own risk. All rights reserved.