
House Prices in Southdown
House prices in Southdown have an overall average of £392,324 over the last year.
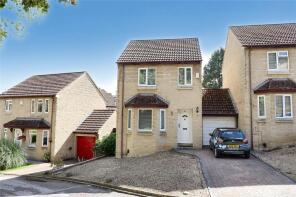
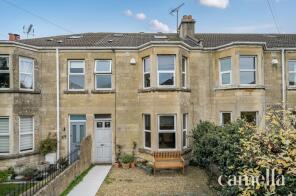
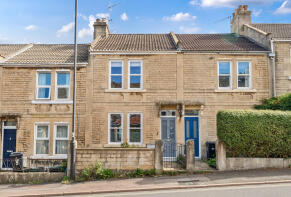
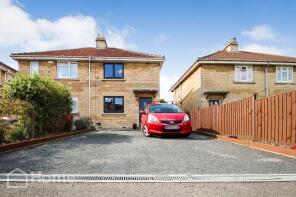
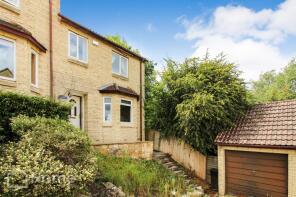
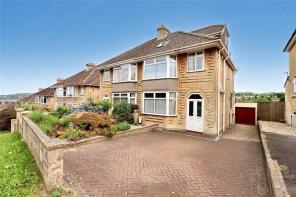
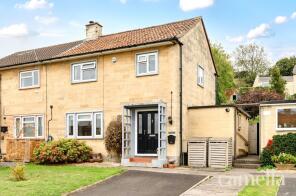
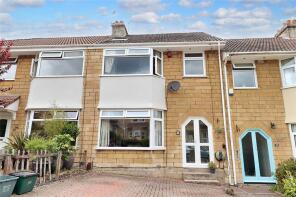
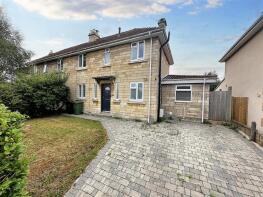
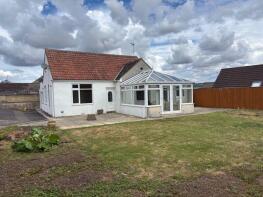
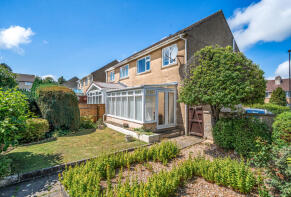
The majority of properties sold in Southdown during the last year were semi-detached properties, selling for an average price of £394,111. Terraced properties sold for an average of £373,496, with detached properties fetching £501,333.
Overall, the historical sold prices in Southdown over the last year were 5% up on the previous year and similar to the 2022 peak of £389,736.
Properties Sold
40, Langdon Road, Southdown, Bath BA2 1LS
| Today | See what it's worth now |
| 31 Mar 2026 | £369,000 |
| 26 Jul 2002 | £148,500 |
No other historical records.
35, Southdown Road, Southdown, Bath BA2 1HJ
| Today | See what it's worth now |
| 20 Mar 2026 | £450,000 |
| 25 Jan 2019 | £385,000 |
4, Sladebrook Avenue, Southdown, Bath BA2 2LA
| Today | See what it's worth now |
| 13 Mar 2026 | £385,000 |
| 4 Sep 2019 | £330,000 |
141, The Hollow, Southdown, Bath BA2 1NJ
| Today | See what it's worth now |
| 11 Mar 2026 | £360,000 |
| 18 Sep 2013 | £220,000 |
36, Southdown Road, Southdown, Bath BA2 1JG
| Today | See what it's worth now |
| 11 Mar 2026 | £301,000 |
| 4 Sep 2015 | £238,250 |
31, Marsden Road, Southdown, Bath BA2 2LJ

| Today | See what it's worth now |
| 11 Mar 2026 | £380,000 |
| 11 Oct 2005 | £215,000 |
No other historical records.
14, Parry Close, Southdown, Bath BA2 1JR
| Today | See what it's worth now |
| 6 Mar 2026 | £314,000 |
| 9 Sep 1997 | £67,500 |
No other historical records.
97, The Hollow, Southdown, Bath BA2 1NE
| Today | See what it's worth now |
| 3 Mar 2026 | £452,500 |
| 18 Jan 2006 | £215,000 |
71, Stirtingale Road, Southdown, Bath BA2 2NG
| Today | See what it's worth now |
| 20 Feb 2026 | £395,000 |
| 22 Jan 2018 | £323,000 |
50, Ivy Avenue, Southdown, Bath BA2 1AL
| Today | See what it's worth now |
| 17 Feb 2026 | £450,000 |
| 12 Nov 1999 | £95,000 |
No other historical records.
34, Roundhill Grove, Southdown, Bath BA2 1JT
| Today | See what it's worth now |
| 13 Feb 2026 | £468,000 |
| 29 May 2015 | £247,000 |
No other historical records.
2a, Hillcrest Drive, Southdown, Bath BA2 1HD

| Today | See what it's worth now |
| 30 Jan 2026 | £490,000 |
| 22 Sep 2022 | £500,000 |
78, Mount Road, Southdown, Bath BA2 1LH
| Today | See what it's worth now |
| 30 Jan 2026 | £357,000 |
| 18 Dec 2009 | £287,500 |
No other historical records.
21, The Hollow, Southdown, Bath BA2 1PA
| Today | See what it's worth now |
| 29 Jan 2026 | £351,000 |
No other historical records.
10, Sladebrook Avenue, Southdown, Bath BA2 2LA
| Today | See what it's worth now |
| 19 Jan 2026 | £401,250 |
| 30 Sep 2021 | £315,000 |
67, Marsden Road, Southdown, Bath BA2 2LQ
| Today | See what it's worth now |
| 14 Jan 2026 | £310,000 |
| 17 May 2017 | £275,000 |
No other historical records.
205, Coronation Avenue, Southdown, Bath BA2 2JZ
| Today | See what it's worth now |
| 9 Jan 2026 | £443,000 |
| 24 Jan 2019 | £320,000 |
No other historical records.
25, Canons Close, Southdown, Bath BA2 2LN
| Today | See what it's worth now |
| 7 Jan 2026 | £375,000 |
| 10 Jul 2020 | £300,000 |
No other historical records.
119, Ivy Avenue, Southdown, Bath BA2 1AW
| Today | See what it's worth now |
| 17 Dec 2025 | £475,000 |
| 19 Dec 2003 | £195,000 |
No other historical records.
Hidden House, Lymore Avenue, Twerton, Bath BA2 1AY
| Today | See what it's worth now |
| 12 Dec 2025 | £860,000 |
No other historical records.
11, Elm Grove, Southdown, Bath BA2 2HJ
| Today | See what it's worth now |
| 5 Dec 2025 | £397,000 |
| 18 Jul 2011 | £174,950 |
No other historical records.
14, Acacia Grove, Southdown, Bath BA2 2HG
| Today | See what it's worth now |
| 28 Nov 2025 | £375,000 |
| 3 Feb 2012 | £213,000 |
40, Marsden Road, Southdown, Bath BA2 2LL
| Today | See what it's worth now |
| 25 Nov 2025 | £321,000 |
No other historical records.
Source Acknowledgement: © Crown copyright. England and Wales house price data is publicly available information produced by the HM Land Registry.This material was last updated on 9 July 2026. It covers the period from 1 January 1995 to 30 April 2026 and contains property transactions which have been registered during that period. Contains HM Land Registry data © Crown copyright and database right 2026. This data is licensed under the Open Government Licence v3.0.
Disclaimer: Rightmove.co.uk provides this HM Land Registry data "as is". The burden for fitness of the data relies completely with the user and is provided for informational purposes only. No warranty, express or implied, is given relating to the accuracy of content of the HM Land Registry data and Rightmove does not accept any liability for error or omission. If you have found an error with the data or need further information please contact HM Land Registry.
Permitted Use: Viewers of this Information are granted permission to access this Crown copyright material and to download it onto electronic, magnetic, optical or similar storage media provided that such activities are for private research, study or in-house use only. Any other use of the material requires the formal written permission of Land Registry which can be requested from us, and is subject to an additional licence and associated charge.
Rightmove takes no liability for your use of, or reliance on, Rightmove's Instant Valuation due to the limitations of our tracking tool listed here. Use of this tool is taken entirely at your own risk. All rights reserved.