
House Prices in SS
House prices in SS have an overall average of £390,933 over the last year.
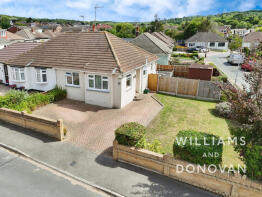
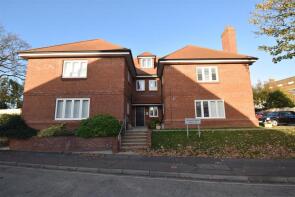
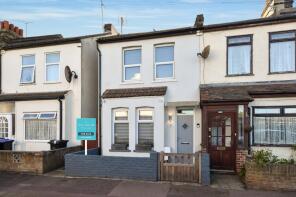
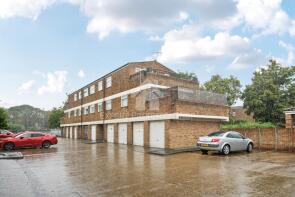
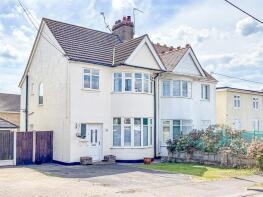
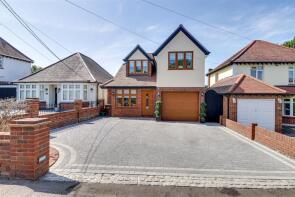
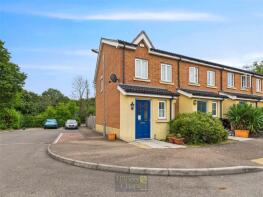
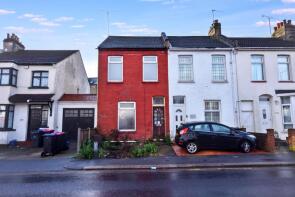
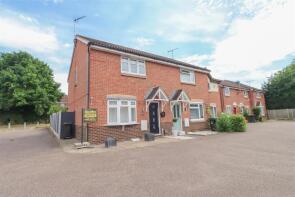
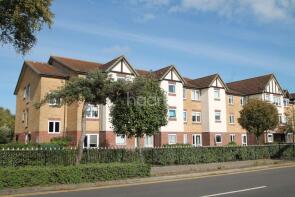
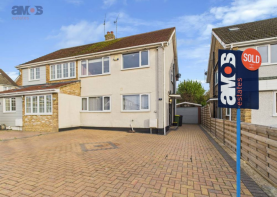
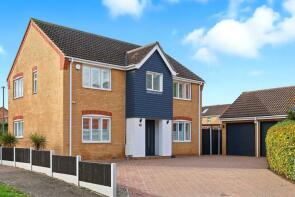
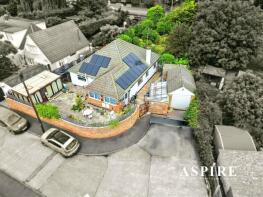
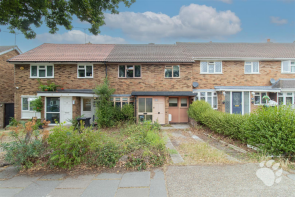
The majority of properties sold in SS during the last year were semi-detached properties, selling for an average price of £404,805. Detached properties sold for an average of £549,834, with terraced properties fetching £335,563.
Overall, the historical sold prices in SS over the last year were 1% up on the previous year and similar to the 2022 peak of £388,668.
Properties Sold
6, Hannett Road, Canvey Island SS8 8LR
| Today | See what it's worth now |
| 27 Mar 2026 | £250,000 |
| 16 Mar 2018 | £240,000 |
118, Danescroft Drive, Leigh-on-sea SS9 4NH
| Today | See what it's worth now |
| 27 Mar 2026 | £320,000 |
| 31 Aug 2000 | £93,000 |
No other historical records.
8b, Cambridge Road, Canvey Island SS8 0EU
| Today | See what it's worth now |
| 27 Mar 2026 | £245,000 |
| 15 May 1998 | £45,000 |
61, Blenheim Chase, Leigh-on-sea SS9 3BZ
| Today | See what it's worth now |
| 27 Mar 2026 | £530,000 |
| 17 Dec 2018 | £425,000 |
64, Constitution Hill, South Benfleet, Benfleet SS7 1ED
| Today | See what it's worth now |
| 27 Mar 2026 | £355,000 |
| 11 Nov 2020 | £310,000 |
4, Elizabeth House, Locks Hill, Rochford SS4 1FR
| Today | See what it's worth now |
| 26 Mar 2026 | £195,000 |
| 15 Apr 2013 | £159,995 |
No other historical records.
75, Beaver Tower, Mansell Close, Leigh-on-sea SS9 5YB
| Today | See what it's worth now |
| 25 Mar 2026 | £70,000 |
| 5 Feb 2013 | £64,000 |
4, Wallace Street, Shoeburyness, Southend-on-sea SS3 9BQ
| Today | See what it's worth now |
| 25 Mar 2026 | £310,000 |
| 21 Dec 2016 | £232,000 |
49, Gordons, Pitsea, Basildon SS13 3DZ
| Today | See what it's worth now |
| 24 Mar 2026 | £235,000 |
| 19 Oct 2007 | £115,000 |
31, Brooklyn Drive, Rayleigh SS6 9LW
| Today | See what it's worth now |
| 24 Mar 2026 | £395,000 |
| 24 Jul 1997 | £78,000 |
No other historical records.
572, Daws Heath Road, Hadleigh, Benfleet SS7 2NL
| Today | See what it's worth now |
| 24 Mar 2026 | £655,000 |
| 2 Dec 2005 | £200,000 |
No other historical records.
60, Beeston Courts, Laindon, Basildon SS15 5FP
| Today | See what it's worth now |
| 24 Mar 2026 | £285,000 |
| 26 Jan 2006 | £168,498 |
No other historical records.
536, Fairfax Drive, Westcliff-on-sea SS0 9RJ
| Today | See what it's worth now |
| 24 Mar 2026 | £180,000 |
| 23 Jan 2026 | £140,000 |
No other historical records.
87, Maitland Road, Wickford SS12 9PU
| Today | See what it's worth now |
| 23 Mar 2026 | £355,000 |
| 13 Jun 2024 | £370,000 |
Flat 7, 31 Nevyll Court, Station Road, Southend-on-sea SS1 3UE
| Today | See what it's worth now |
| 23 Mar 2026 | £150,000 |
| 20 May 2015 | £145,000 |
3, Hawthorn Way, Rayleigh SS6 8SP
| Today | See what it's worth now |
| 23 Mar 2026 | £415,000 |
| 6 Sep 2019 | £290,000 |
No other historical records.
58, Laburnum Way, Rayleigh SS6 9GN
| Today | See what it's worth now |
| 23 Mar 2026 | £695,000 |
| 8 Dec 2017 | £550,000 |
450, Arterial Road, Leigh-on-sea SS9 4DS
| Today | See what it's worth now |
| 23 Mar 2026 | £375,000 |
| 6 Aug 2013 | £247,500 |
No other historical records.
8, Avenue Terrace, Westcliff-on-sea SS0 7PL
| Today | See what it's worth now |
| 20 Mar 2026 | £312,500 |
| 1 Oct 2019 | £295,000 |
610, Whitmore Way, Basildon SS14 2EP
| Today | See what it's worth now |
| 20 Mar 2026 | £325,000 |
No other historical records.
73, Lesney Gardens, Rochford SS4 1TZ
| Today | See what it's worth now |
| 20 Mar 2026 | £105,000 |
| 31 Oct 1995 | £18,000 |
No other historical records.
Flat 2, The Plaza, Royal Mews, Southend-on-sea SS1 1GL
| Today | See what it's worth now |
| 20 Mar 2026 | £190,000 |
No other historical records.
55, Gunners Rise, Southend-on-sea SS3 9FD
| Today | See what it's worth now |
| 20 Mar 2026 | £618,000 |
| 21 Dec 2012 | £333,000 |
No other historical records.
49, Tower Court, Westcliff Parade, Westcliff-on-sea SS0 7QH
| Today | See what it's worth now |
| 20 Mar 2026 | £307,500 |
| 27 Mar 2020 | £270,000 |
No other historical records.
62, Manchester Drive, Leigh-on-sea SS9 3HR
| Today | See what it's worth now |
| 20 Mar 2026 | £348,000 |
| 14 Jul 2011 | £170,000 |
Source Acknowledgement: © Crown copyright. England and Wales house price data is publicly available information produced by the HM Land Registry.This material was last updated on 15 May 2026. It covers the period from 1 January 1995 to 31 March 2026 and contains property transactions which have been registered during that period. Contains HM Land Registry data © Crown copyright and database right 2026. This data is licensed under the Open Government Licence v3.0.
Disclaimer: Rightmove.co.uk provides this HM Land Registry data "as is". The burden for fitness of the data relies completely with the user and is provided for informational purposes only. No warranty, express or implied, is given relating to the accuracy of content of the HM Land Registry data and Rightmove does not accept any liability for error or omission. If you have found an error with the data or need further information please contact HM Land Registry.
Permitted Use: Viewers of this Information are granted permission to access this Crown copyright material and to download it onto electronic, magnetic, optical or similar storage media provided that such activities are for private research, study or in-house use only. Any other use of the material requires the formal written permission of Land Registry which can be requested from us, and is subject to an additional licence and associated charge.
Map data ©OpenStreetMap contributors.
Rightmove takes no liability for your use of, or reliance on, Rightmove's Instant Valuation due to the limitations of our tracking tool listed here. Use of this tool is taken entirely at your own risk. All rights reserved.