
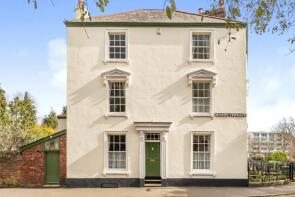
House Prices in St. Davids
House prices in St. Davids have an overall average of £364,057 over the last year.
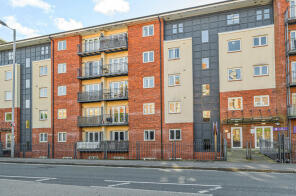
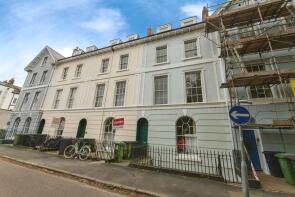
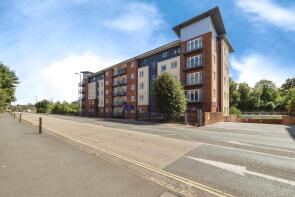
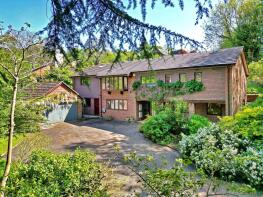
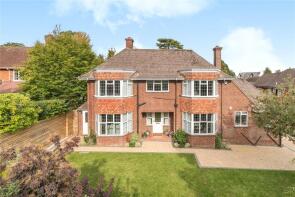
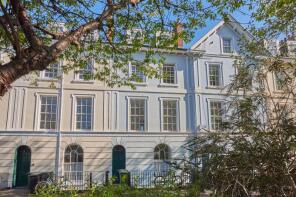
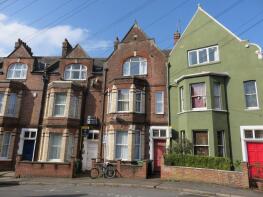
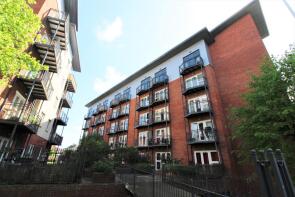
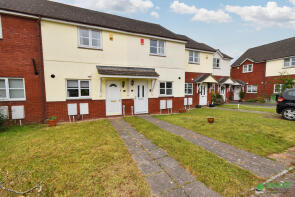
The majority of properties sold in St. Davids during the last year were flats, selling for an average price of £174,522. Terraced properties sold for an average of £391,083, with detached properties fetching £693,571.
Overall, the historical sold prices in St. Davids over the last year were 5% down on the previous year and 5% down on the 2021 peak of £383,280.
Properties Sold
1, Queens Terrace, Exeter EX4 4HR
| Today | See what it's worth now |
| 19 Mar 2026 | £765,000 |
| 28 Mar 1995 | £60,000 |
No other historical records.
9, Augustus House, New North Road, Exeter EX4 4HL
| Today | See what it's worth now |
| 6 Mar 2026 | £110,000 |
| 22 Nov 2006 | £102,000 |
Flat 3, 37, Haldon Road, Exeter EX4 4DZ
| Today | See what it's worth now |
| 6 Feb 2026 | £110,000 |
| 9 Jul 2021 | £165,000 |
Flat 1, 4, Richmond Road, Exeter EX4 4JA
| Today | See what it's worth now |
| 3 Feb 2026 | £160,000 |
| 20 Mar 2007 | £148,000 |
27, Augustus House, New North Road, Exeter EX4 4HL
| Today | See what it's worth now |
| 2 Feb 2026 | £155,000 |
| 26 Aug 2014 | £174,000 |
No other historical records.
41, Richmond Court, Exeter EX4 3RA
| Today | See what it's worth now |
| 30 Jan 2026 | £200,000 |
No other historical records.
1, Duryard Grange, Lower Argyll Road, Exeter EX4 4QY
| Today | See what it's worth now |
| 29 Jan 2026 | £850,000 |
No other historical records.
Flat 4, 64, Howell Road, Exeter EX4 4LZ

| Today | See what it's worth now |
| 6 Jan 2026 | £140,000 |
| 27 Jul 2007 | £105,000 |
No other historical records.
30, West Avenue, Exeter EX4 4SE
| Today | See what it's worth now |
| 18 Dec 2025 | £910,000 |
| 3 Mar 2023 | £1,020,000 |
No other historical records.
19, New North Road, Exeter EX4 4HF

| Today | See what it's worth now |
| 5 Dec 2025 | £288,900 |
| 1 Apr 2015 | £230,000 |
No other historical records.
Flat 3, 4, Richmond Road, Exeter EX4 4JA
| Today | See what it's worth now |
| 20 Nov 2025 | £190,000 |
| 14 Apr 2014 | £158,000 |
Flat 4, 43, Haldon Road, Exeter EX4 4DZ
| Today | See what it's worth now |
| 11 Nov 2025 | £132,500 |
| 25 Aug 1999 | £34,950 |
18, Marcus House, New North Road, Exeter EX4 4JN
| Today | See what it's worth now |
| 31 Oct 2025 | £106,000 |
| 30 Sep 2015 | £105,000 |
No other historical records.
12, High Croft, Exeter EX4 4JQ

| Today | See what it's worth now |
| 30 Oct 2025 | £735,000 |
No other historical records.
22, Castle Mount, Exeter EX4 4JW
| Today | See what it's worth now |
| 17 Oct 2025 | £280,000 |
| 13 Aug 2007 | £176,000 |
31, Augustus House, New North Road, Exeter EX4 4HL
| Today | See what it's worth now |
| 13 Oct 2025 | £100,000 |
| 23 Jul 2010 | £77,500 |
No other historical records.
6 St Davids Place, Red Cow Village, Cycle Track From St Davids Station To Cowley Bridge Road, Exeter EX4 4AU
| Today | See what it's worth now |
| 6 Oct 2025 | £210,000 |
No other historical records.
5, Hillcrest Park, Exeter EX4 4SH
| Today | See what it's worth now |
| 30 Sep 2025 | £656,000 |
| 7 Sep 2022 | £580,000 |
55, St Davids Hill, Exeter EX4 4DW
| Today | See what it's worth now |
| 23 Sep 2025 | £348,000 |
| 25 Feb 2022 | £343,000 |
3, Montague Rise, Exeter EX4 4UZ
| Today | See what it's worth now |
| 19 Sep 2025 | £273,000 |
| 22 Dec 1999 | £83,950 |
No other historical records.
85, Richmond Court, Exeter EX4 3RD
| Today | See what it's worth now |
| 29 Aug 2025 | £225,000 |
No other historical records.
32, Thornton Hill, Exeter EX4 4NS

| Today | See what it's worth now |
| 22 Aug 2025 | £620,000 |
No other historical records.
31, Lower North Street, Exeter EX4 3EU
| Today | See what it's worth now |
| 21 Aug 2025 | £190,000 |
No other historical records.
Source Acknowledgement: © Crown copyright. England and Wales house price data is publicly available information produced by the HM Land Registry.This material was last updated on 15 May 2026. It covers the period from 1 January 1995 to 31 March 2026 and contains property transactions which have been registered during that period. Contains HM Land Registry data © Crown copyright and database right 2026. This data is licensed under the Open Government Licence v3.0.
Disclaimer: Rightmove.co.uk provides this HM Land Registry data "as is". The burden for fitness of the data relies completely with the user and is provided for informational purposes only. No warranty, express or implied, is given relating to the accuracy of content of the HM Land Registry data and Rightmove does not accept any liability for error or omission. If you have found an error with the data or need further information please contact HM Land Registry.
Permitted Use: Viewers of this Information are granted permission to access this Crown copyright material and to download it onto electronic, magnetic, optical or similar storage media provided that such activities are for private research, study or in-house use only. Any other use of the material requires the formal written permission of Land Registry which can be requested from us, and is subject to an additional licence and associated charge.
Map data ©OpenStreetMap contributors.
Rightmove takes no liability for your use of, or reliance on, Rightmove's Instant Valuation due to the limitations of our tracking tool listed here. Use of this tool is taken entirely at your own risk. All rights reserved.