
House Prices in St. Cleer
House prices in St. Cleer have an overall average of £294,130 over the last year.
The majority of properties sold in St. Cleer during the last year were detached properties, selling for an average price of £350,643. Semi-detached properties sold for an average of £199,600, with terraced properties fetching £214,500.
Overall, the historical sold prices in St. Cleer over the last year were 25% up on the previous year and 3% down on the 2022 peak of £303,944.
Properties Sold
6, The Glebe, Liskeard PL14 5FG
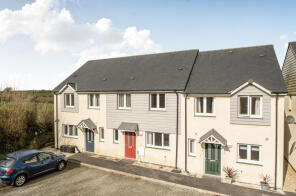
| Today | See today's value |
| 17 Jul 2026 | £200,000 |
| 13 Mar 2015 | £156,000 |
No other historical records.
3, Baynes Close, Liskeard PL14 5RT

| Today | See today's value |
| 30 Jun 2026 | £208,000 |
| 27 Aug 2020 | £152,500 |
No other historical records.
The Old Railway Yard, Well Lane, Liskeard PL14 5EA
| Today | See today's value |
| 10 Jun 2026 | £605,000 |
No other historical records.
12, Penhale Meadow, Liskeard PL14 5RR
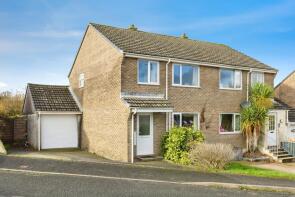
| Today | See today's value |
| 1 Jun 2026 | £215,000 |
| 27 Sep 2012 | £127,500 |
9, Trenouth Close, Liskeard PL14 5SQ

| Today | See today's value |
| 27 Mar 2026 | £284,000 |
| 4 Oct 2019 | £215,000 |
35, Penhale Meadow, Liskeard PL14 5RR

| Today | See today's value |
| 23 Mar 2026 | £230,000 |
| 16 Aug 2018 | £172,000 |
Pitts Park, Road From Junction South West Of Common Moor To Fore Street, Liskeard PL14 5DN

| Today | See today's value |
| 6 Mar 2026 | £465,000 |
| 3 Jul 1998 | £59,000 |
No other historical records.
1, Trecarne View, Liskeard PL14 5BS

| Today | See today's value |
| 3 Mar 2026 | £287,500 |
| 3 May 2023 | £285,000 |
8, Penhale Close, Liskeard PL14 5BY

| Today | See today's value |
| 3 Mar 2026 | £267,500 |
| 29 Nov 2019 | £240,000 |
Trenarren, Road From Junction South West Of Common Moor To Fore Street, Liskeard PL14 5DN

| Today | See today's value |
| 9 Feb 2026 | £460,000 |
| 2 Apr 2002 | £212,000 |
No other historical records.
5, Welsby Terrace, Fore Street, Liskeard PL14 5DR

| Today | See today's value |
| 30 Jan 2026 | £330,000 |
| 27 Jan 2021 | £240,000 |
1, Humphreys Close, Liskeard PL14 5DP

| Today | See today's value |
| 16 Jan 2026 | £325,000 |
| 18 Aug 2017 | £240,000 |
1, Highland Court, Road From Junction North Of Higher Trelaske To Kensa, Liskeard PL14 6EU

| Today | See today's value |
| 18 Dec 2025 | £365,000 |
| 17 Aug 2007 | £250,000 |
No other historical records.
6, Meadow Terrace, Tremar Lane, Liskeard PL14 5DL

| Today | See today's value |
| 17 Dec 2025 | £240,000 |
| 19 May 2003 | £117,000 |
15, Tom Nicolls Close, Liskeard PL14 5SD

| Today | See today's value |
| 15 Dec 2025 | £163,000 |
| 27 May 2020 | £134,500 |
Chy-an-gwel, Tremar Lane, Liskeard PL14 5DQ

| Today | See today's value |
| 12 Dec 2025 | £310,000 |
| 2 May 2014 | £250,000 |
18, Diggorys Field, Liskeard PL14 5RS

| Today | See today's value |
| 14 Nov 2025 | £230,000 |
| 16 Jul 2018 | £177,500 |
11, Baynes Close, Liskeard PL14 5RT

| Today | See today's value |
| 13 Nov 2025 | £210,000 |
| 30 Jun 2021 | £165,000 |
Butterfly Cottage, Fore Street, Liskeard PL14 5DS

| Today | See today's value |
| 7 Nov 2025 | £160,000 |
| 20 Apr 2018 | £130,000 |
34 Karuna, Diggorys Field, Liskeard PL14 5RS
| Today | See today's value |
| 31 Oct 2025 | £250,000 |
| 3 Apr 2002 | £119,000 |
14, Trenouth Close, Liskeard PL14 5SQ

| Today | See today's value |
| 27 Oct 2025 | £375,000 |
| 5 Jul 2017 | £260,000 |
32, Kilmar Way, Liskeard PL14 5LU

| Today | See today's value |
| 27 Oct 2025 | £285,000 |
| 1 May 2015 | £184,000 |
Kerdhynen, Road From Junction South West Of Common Moor To Fore Street, Liskeard PL14 5DN

| Today | See today's value |
| 7 Oct 2025 | £300,000 |
| 30 Jul 2007 | £218,000 |


Rightmove takes no liability for your use of, or reliance on, Rightmove's Instant Valuation due to the limitations of our tracking tool listed here. Use of this tool is taken entirely at your own risk. All rights reserved.