
House Prices in St. Mellion
House prices in St. Mellion have an overall average of £762,500 over the last year.
Overall, the historical sold prices in St. Mellion over the last year were 9% up on the previous year and 18% up on the 2023 peak of £645,583.
Properties Sold
1, The Rowans, Saltash PL12 6UT
| Today | See what it's worth now |
| 5 Feb 2026 | £575,000 |
| 31 Jul 2000 | £225,000 |
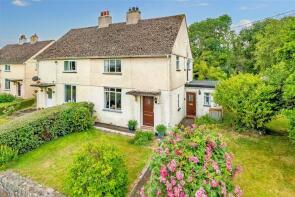
3, Vinegar Hill, Saltash PL12 6QA

| Today | See what it's worth now |
| 5 Nov 2025 | £430,000 |
| 10 Jan 2019 | £282,500 |
No other historical records.
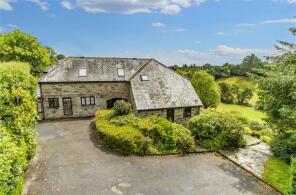
Tor Farm, Pillaton PL12 5AT
| Today | See what it's worth now |
| 16 Oct 2025 | £1,300,000 |
No other historical records.
2, The Rowans, Saltash PL12 6UT
| Today | See what it's worth now |
| 3 Jul 2025 | £745,000 |
| 22 Feb 2023 | £795,000 |
17, Keason Hill, Saltash PL12 6UU
| Today | See what it's worth now |
| 22 Apr 2025 | £726,000 |
| 6 Dec 2013 | £475,000 |
7, Oakridge, Access To Oakridge, Saltash PL12 6UY
| Today | See what it's worth now |
| 31 Mar 2025 | £215,000 |
| 27 Feb 2019 | £125,000 |
No other historical records.
5, Oak Avenue, Orchard Close, Saltash PL12 6UF

| Today | See what it's worth now |
| 21 Mar 2025 | £665,000 |
| 28 Feb 1995 | £167,000 |
No other historical records.
5, Dunstan Lane, St. Mellion, St Mellion PL12 6UE
| Today | See what it's worth now |
| 6 Mar 2025 | £830,000 |
No other historical records.
3, Dunstan Lane, Saltash PL12 6UE
| Today | See what it's worth now |
| 6 Dec 2024 | £790,000 |
| 12 Feb 2016 | £470,000 |
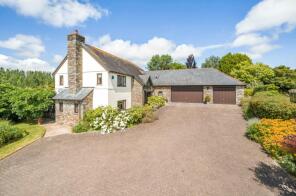
Saunton House, Road From Briston Orchard To Hornifast Wood, Saltash PL12 6RQ

| Today | See what it's worth now |
| 17 Sep 2024 | £910,000 |
| 29 Jul 2010 | £675,000 |
1 Lyndon House, Dunstan Lane, Saltash PL12 6UE

| Today | See what it's worth now |
| 4 Sep 2024 | £760,000 |
| 17 Mar 2015 | £550,000 |
Tremoan Cottage, Road From Dunstan Lane To The Crossroads At Horsepool, Saltash PL12 6RH

| Today | See what it's worth now |
| 31 May 2024 | £1,130,000 |
| 14 Jan 2011 | £278,000 |
No other historical records.
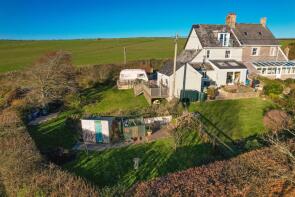
Lower Axford Farm, St Germans Road, Callington PL17 7HU
| Today | See what it's worth now |
| 5 Mar 2024 | £810,000 |
| 24 Jun 2020 | £695,000 |
No other historical records.
Woolaton Barn, St. Mellion, St Mellion PL12 6RN

| Today | See what it's worth now |
| 22 Feb 2024 | £237,500 |
No other historical records.
10, Dunstan Lane, Saltash PL12 6UE
| Today | See what it's worth now |
| 8 Dec 2023 | £830,000 |
| 23 Jun 2023 | £875,000 |
8, The Glebe, Saltash PL12 6RF
| Today | See what it's worth now |
| 6 Nov 2023 | £255,000 |
No other historical records.
3, The Rowans, Saltash PL12 6UT
| Today | See what it's worth now |
| 23 Oct 2023 | £875,000 |
| 4 Aug 2004 | £475,000 |
Tipwell House, Road From Ashton To Halton Barton, Saltash PL12 6RS

| Today | See what it's worth now |
| 16 Oct 2023 | £745,000 |
| 13 Oct 2005 | £407,500 |
Trescore, Road From Axford Hill To Roskilly, Saltash PL12 6RX
| Today | See what it's worth now |
| 31 May 2023 | £440,000 |
| 15 Jun 2011 | £275,000 |
Freers Farm, Callington PL17 7HT

| Today | See what it's worth now |
| 6 Apr 2023 | £625,000 |
No other historical records.
Briston Farmhouse, A388 Between Paynters Cross And The Glebe, Saltash PL12 6RQ
| Today | See what it's worth now |
| 24 Feb 2023 | £725,000 |
| 24 Jul 1995 | £75,000 |
No other historical records.
6 High Bullen, Wood Drive, Saltash PL12 6UR
| Today | See what it's worth now |
| 22 Feb 2023 | £825,000 |
| 11 Jul 2013 | £530,000 |
No other historical records.
9, Oakridge, Access To Oakridge, Saltash PL12 6UY
| Today | See what it's worth now |
| 21 Feb 2023 | £220,000 |
No other historical records.


Source Acknowledgement: © Crown copyright. England and Wales house price data is publicly available information produced by the HM Land Registry.This material was last updated on 9 July 2026. It covers the period from 1 January 1995 to 30 April 2026 and contains property transactions which have been registered during that period. Contains HM Land Registry data © Crown copyright and database right 2026. This data is licensed under the Open Government Licence v3.0.
Disclaimer: Rightmove.co.uk provides this HM Land Registry data "as is". The burden for fitness of the data relies completely with the user and is provided for informational purposes only. No warranty, express or implied, is given relating to the accuracy of content of the HM Land Registry data and Rightmove does not accept any liability for error or omission. If you have found an error with the data or need further information please contact HM Land Registry.
Permitted Use: Viewers of this Information are granted permission to access this Crown copyright material and to download it onto electronic, magnetic, optical or similar storage media provided that such activities are for private research, study or in-house use only. Any other use of the material requires the formal written permission of Land Registry which can be requested from us, and is subject to an additional licence and associated charge.
Rightmove takes no liability for your use of, or reliance on, Rightmove's Instant Valuation due to the limitations of our tracking tool listed here. Use of this tool is taken entirely at your own risk. All rights reserved.