
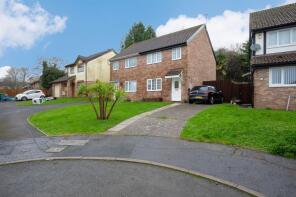
House Prices in St. Mellons
House prices in St. Mellons have an overall average of £259,754 over the last year.
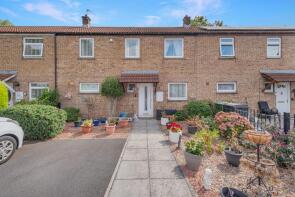
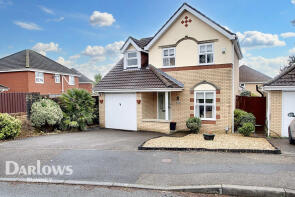
The majority of properties sold in St. Mellons during the last year were terraced properties, selling for an average price of £216,274. Semi-detached properties sold for an average of £257,417, with detached properties fetching £345,539.
Overall, the historical sold prices in St. Mellons over the last year were 1% up on the previous year and 4% up on the 2023 peak of £249,416.
Properties Sold
10, Osprey Close, Trowbridge, Cardiff CF3 0DG
| Today | See what it's worth now |
| 15 Apr 2026 | £272,000 |
| 1 May 2020 | £198,000 |
12, Poppyfield Close, Trowbridge, Cardiff CF3 0BD
| Today | See what it's worth now |
| 7 Apr 2026 | £212,000 |
No other historical records.
1, Gould Close, Old St Mellons, Cardiff CF3 5BD
| Today | See what it's worth now |
| 2 Apr 2026 | £370,000 |
| 7 Aug 2000 | £104,950 |
6, Chester Close, Trowbridge, Cardiff CF3 0EP
| Today | See what it's worth now |
| 27 Mar 2026 | £240,000 |
| 25 Mar 2011 | £123,500 |
6, Heathcliffe Close, Old St Mellons, Cardiff CF3 5PY
| Today | See what it's worth now |
| 23 Mar 2026 | £250,000 |
| 14 Sep 2005 | £175,000 |
3c, Matthysens Way, Trowbridge, Cardiff CF3 0PL

| Today | See what it's worth now |
| 20 Mar 2026 | £220,000 |
| 6 Jun 2007 | £210,000 |
No other historical records.
63, Sanderling Drive, Trowbridge, Cardiff CF3 0DH
| Today | See what it's worth now |
| 20 Mar 2026 | £210,000 |
| 13 Aug 2010 | £121,500 |
4, Pennyroyal Close, Trowbridge, Cardiff CF3 0NA
| Today | See what it's worth now |
| 20 Mar 2026 | £215,000 |
| 27 Jul 2018 | £127,500 |
15, Hazelwood Drive, Trowbridge, Cardiff CF3 0BS
| Today | See what it's worth now |
| 12 Mar 2026 | £165,000 |
| 20 Nov 2023 | £160,000 |
16, Glenrise Close, Trowbridge, Cardiff CF3 0AS
| Today | See what it's worth now |
| 6 Mar 2026 | £208,000 |
| 31 Mar 2023 | £170,000 |
No other historical records.
4, Chervil Close, Trowbridge, Cardiff CF3 0NL
| Today | See what it's worth now |
| 6 Mar 2026 | £220,000 |
| 16 May 1995 | £55,000 |
No other historical records.
Ty Newydd, Newport Road, Rumney, Cardiff CF3 5TW
| Today | See what it's worth now |
| 6 Mar 2026 | £605,000 |
| 2 Oct 2003 | £250,000 |
No other historical records.
14, Harrison Drive, Trowbridge, Cardiff CF3 0NU
| Today | See what it's worth now |
| 27 Feb 2026 | £225,000 |
| 24 Jun 2016 | £142,500 |
10, Kember Close, Trowbridge, Cardiff CF3 0NW
| Today | See what it's worth now |
| 25 Feb 2026 | £340,000 |
| 11 Aug 2017 | £240,000 |
8, Great Burnet Close, Trowbridge, Cardiff CF3 0RJ
| Today | See what it's worth now |
| 20 Feb 2026 | £225,000 |
| 24 Oct 2022 | £200,000 |
Woodways, Cummings Farm, Newport Road, Trowbridge, Cardiff CF3 5UA
| Today | See what it's worth now |
| 20 Feb 2026 | £395,010 |
No other historical records.
8, Runcorn Close, Old St Mellons, Cardiff CF3 5PZ
| Today | See what it's worth now |
| 20 Feb 2026 | £190,000 |
No other historical records.
7, Lloyd Place, Trowbridge, Cardiff CF3 0NX
| Today | See what it's worth now |
| 19 Feb 2026 | £210,000 |
| 5 Apr 2023 | £195,000 |
3, Spencer David Way, Trowbridge, Cardiff CF3 0QB
| Today | See what it's worth now |
| 19 Feb 2026 | £155,000 |
| 30 Mar 2012 | £102,000 |
No other historical records.
11, Jasmine Drive, Trowbridge, Cardiff CF3 0JD
| Today | See what it's worth now |
| 13 Feb 2026 | £300,000 |
| 6 Feb 2023 | £285,000 |
1, Stonechat Close, Trowbridge, Cardiff CF3 0PF

| Today | See what it's worth now |
| 13 Feb 2026 | £325,500 |
| 29 Sep 2023 | £275,000 |
No other historical records.
7, Tarwick Drive, Trowbridge, Cardiff CF3 0AF
| Today | See what it's worth now |
| 13 Feb 2026 | £235,000 |
| 23 Sep 2009 | £60,000 |
No other historical records.
64, Harrison Drive, Trowbridge, Cardiff CF3 0PJ
| Today | See what it's worth now |
| 6 Feb 2026 | £305,000 |
| 26 Jun 2020 | £190,000 |

Source Acknowledgement: © Crown copyright. England and Wales house price data is publicly available information produced by the HM Land Registry.This material was last updated on 9 July 2026. It covers the period from 1 January 1995 to 30 April 2026 and contains property transactions which have been registered during that period. Contains HM Land Registry data © Crown copyright and database right 2026. This data is licensed under the Open Government Licence v3.0.
Disclaimer: Rightmove.co.uk provides this HM Land Registry data "as is". The burden for fitness of the data relies completely with the user and is provided for informational purposes only. No warranty, express or implied, is given relating to the accuracy of content of the HM Land Registry data and Rightmove does not accept any liability for error or omission. If you have found an error with the data or need further information please contact HM Land Registry.
Permitted Use: Viewers of this Information are granted permission to access this Crown copyright material and to download it onto electronic, magnetic, optical or similar storage media provided that such activities are for private research, study or in-house use only. Any other use of the material requires the formal written permission of Land Registry which can be requested from us, and is subject to an additional licence and associated charge.
Rightmove takes no liability for your use of, or reliance on, Rightmove's Instant Valuation due to the limitations of our tracking tool listed here. Use of this tool is taken entirely at your own risk. All rights reserved.