
House Prices in Stone Cross
House prices in Stone Cross have an overall average of £395,429 over the last year.
The majority of properties sold in Stone Cross during the last year were detached properties, selling for an average price of £620,736. Semi-detached properties sold for an average of £346,737, with terraced properties fetching £279,444.
Overall, the historical sold prices in Stone Cross over the last year were 8% up on the previous year and 3% up on the 2022 peak of £384,867.
Properties Sold
50, Mill Green, Eastry CT13 0LE
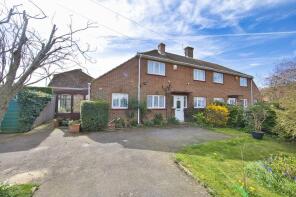
| Today | See today's value |
| 14 Aug 2026 | £270,000 |
No other historical records.
41, Dover Road, Sandwich CT13 0BX
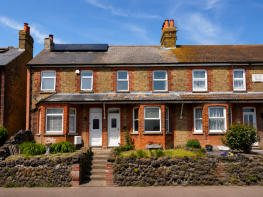
| Today | See today's value |
| 14 Aug 2026 | £240,000 |
| 28 Jul 1995 | £43,000 |
No other historical records.
1, Walnut Tree Cottages, Heronden Road, Sandwich CT13 0ES
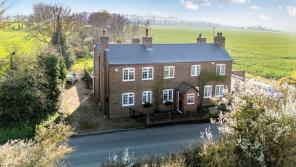
| Today | See today's value |
| 12 Aug 2026 | £495,000 |
| 1 Mar 2007 | £279,950 |
No other historical records.
Lotus Cottage, Poulders Road, Sandwich CT13 0LU
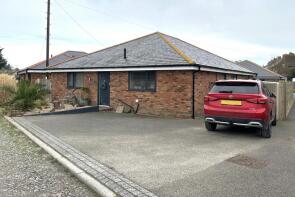
| Today | See today's value |
| 12 Aug 2026 | £530,000 |
| 1 Apr 2022 | £500,000 |
No other historical records.
8, Woodland Way, Sandwich CT13 0NG
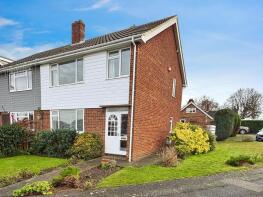
| Today | See today's value |
| 6 Aug 2026 | £319,000 |
| 20 Jun 2022 | £288,000 |
No other historical records.
6, Townmill Road, Sandwich CT13 0FW

| Today | See today's value |
| 3 Aug 2026 | £380,000 |
| 3 Mar 2022 | £365,000 |
No other historical records.
54, Fordwich Place, Sandwich CT13 0RA
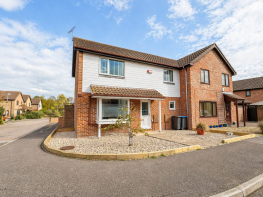
| Today | See today's value |
| 22 Jul 2026 | £350,000 |
| 6 Jun 2013 | £190,000 |
29, Peak Drive, Sandwich CT13 0DY
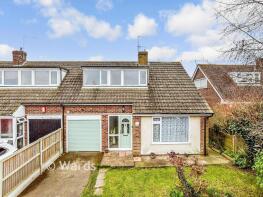
| Today | See today's value |
| 21 Jul 2026 | £235,000 |
| 25 Apr 2016 | £217,000 |
No other historical records.
30, St Barts Road, Sandwich CT13 0BG

| Today | See today's value |
| 15 Jul 2026 | £250,000 |
| 15 Jan 2021 | £210,000 |
No other historical records.
83, Laburnum Avenue, Sandwich CT13 0AU

| Today | See today's value |
| 14 Jul 2026 | £280,000 |
| 10 Feb 2012 | £132,500 |
No other historical records.
4, Oast Cottages, The Street, Sandwich CT13 0NH
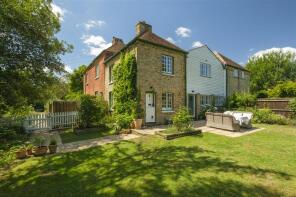
| Today | See today's value |
| 13 Jul 2026 | £418,000 |
| 10 Jan 2020 | £354,500 |
39, Alliss Gardens, Sandwich CT13 0GQ
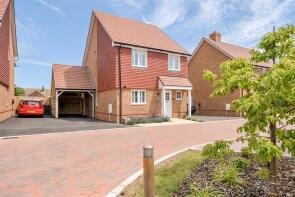
| Today | See today's value |
| 7 Jul 2026 | £380,000 |
| 20 Jul 2022 | £400,000 |
No other historical records.
4, Church Street, Sandwich CT13 0HH
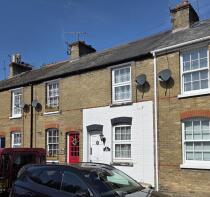
| Today | See today's value |
| 2 Jul 2026 | £190,000 |
| 26 Oct 2010 | £147,500 |
50, Dover Road, Sandwich CT13 0BY
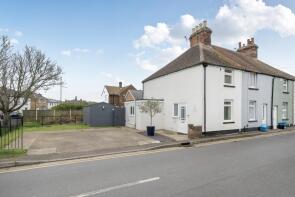
| Today | See today's value |
| 30 Jun 2026 | £257,000 |
| 30 Jul 2021 | £257,000 |
The Aumbry, Church Street, Eastry CT13 0HJ
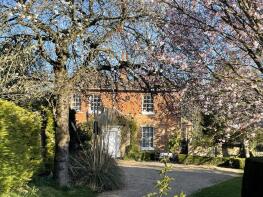
| Today | See today's value |
| 29 Jun 2026 | £1,100,000 |
No other historical records.
5, The Old Vicarage, The Street, Sandwich CT13 0QT

| Today | See today's value |
| 29 May 2026 | £97,500 |
| 21 Oct 1996 | £35,000 |
No other historical records.
Jelena House, Gore Lane, Eastry CT13 0ED
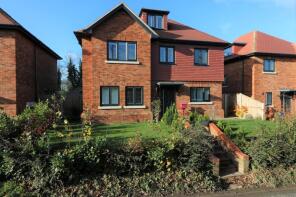
| Today | See today's value |
| 27 May 2026 | £399,950 |
No other historical records.
8, Townmill Road, Sandwich CT13 0FW
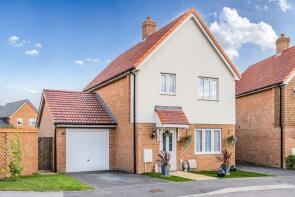
| Today | See today's value |
| 22 May 2026 | £395,000 |
| 2 Mar 2022 | £375,000 |
No other historical records.
2, Sandwich Hill Cottages, Sandwich Road, Sandwich CT13 0DR
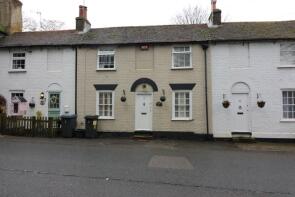
| Today | See today's value |
| 1 May 2026 | £240,000 |
| 26 Oct 2018 | £219,000 |
62, Hazelwood Meadow, Sandwich CT13 0AR
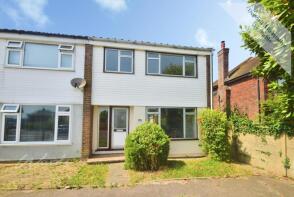
| Today | See today's value |
| 27 Apr 2026 | £230,000 |
| 27 Apr 2012 | £142,000 |
Gable Cottage, Beacon Lane, Sandwich CT13 0PD

| Today | See today's value |
| 16 Apr 2026 | £865,000 |
| 4 Oct 2002 | £340,000 |
No other historical records.
29, Woodnesborough Road, Sandwich CT13 0AA
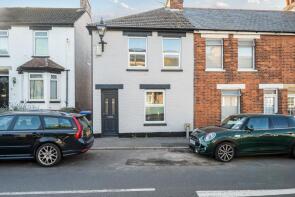
| Today | See today's value |
| 16 Apr 2026 | £282,500 |
| 19 Mar 2025 | £175,000 |
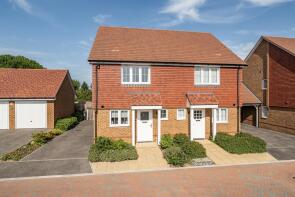
7, Eastry Park, Sandwich CT13 0JL

| Today | See today's value |
| 10 Apr 2026 | £575,000 |
| 23 May 2018 | £463,000 |

Rightmove takes no liability for your use of, or reliance on, Rightmove's Instant Valuation due to the limitations of our tracking tool listed here. Use of this tool is taken entirely at your own risk. All rights reserved.