
House Prices in Stoneborough
House prices in Stoneborough have an overall average of £544,775 over the last year.
The majority of properties sold in Stoneborough during the last year were detached properties, selling for an average price of £817,579. Flats sold for an average of £253,866, with terraced properties fetching £454,962.
Overall, the historical sold prices in Stoneborough over the last year were 11% up on the previous year and 12% up on the 2023 peak of £487,536.
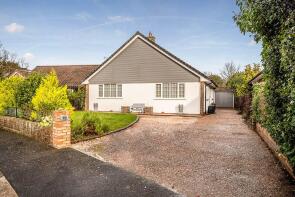
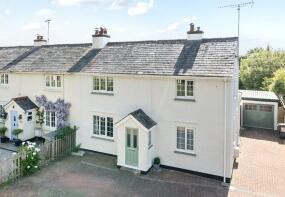
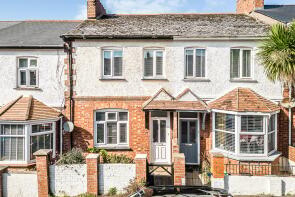
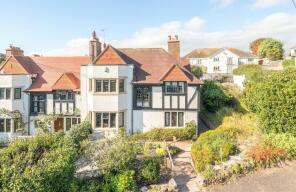
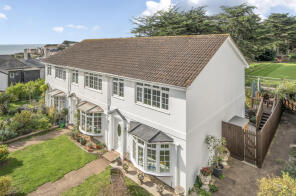
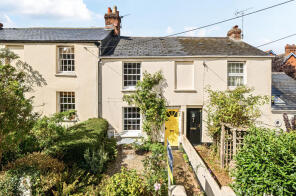
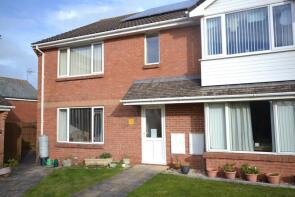
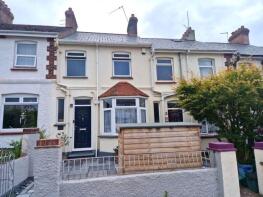
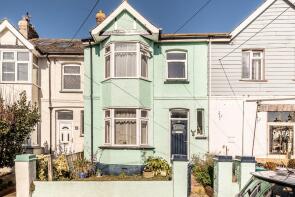
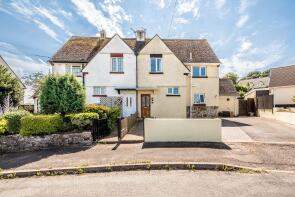
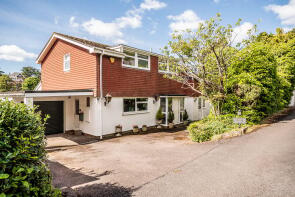
Properties Sold
19, Meadow Close, Budleigh Salterton EX9 6JN
| Today | See what it's worth now |
| 15 Apr 2026 | £725,000 |
| 6 Jul 2015 | £335,000 |
17, Victoria Place, Budleigh Salterton EX9 6JP

| Today | See what it's worth now |
| 20 Mar 2026 | £625,000 |
| 8 Aug 2008 | £345,000 |
14, Knowle Village, Knowle, Budleigh Salterton EX9 6AL
| Today | See what it's worth now |
| 20 Mar 2026 | £475,000 |
| 12 Feb 2010 | £228,000 |
No other historical records.
27, Boyne Road, Budleigh Salterton EX9 6SE
| Today | See what it's worth now |
| 19 Mar 2026 | £272,000 |
| 22 Sep 2023 | £276,000 |
7, The Lawn, Budleigh Salterton EX9 6LT
| Today | See what it's worth now |
| 13 Mar 2026 | £365,000 |
| 8 May 2024 | £310,000 |
10, Victoria Place, Budleigh Salterton EX9 6JP
| Today | See what it's worth now |
| 6 Mar 2026 | £500,000 |
| 21 Jan 2022 | £350,000 |
No other historical records.
17a, Knowle Road, Budleigh Salterton EX9 6AR
| Today | See what it's worth now |
| 5 Mar 2026 | £675,000 |
| 15 Sep 2014 | £450,000 |
Flat 4, 9 Copplestone House, Bedlands Lane, Budleigh Salterton EX9 6QN
| Today | See what it's worth now |
| 4 Mar 2026 | £135,000 |
| 4 Aug 2006 | £167,500 |
49, Norman Crescent, Budleigh Salterton EX9 6RB
| Today | See what it's worth now |
| 2 Mar 2026 | £198,000 |
| 22 Sep 2023 | £185,000 |
2, Pebble Reach, High Street, Budleigh Salterton EX9 6LD
| Today | See what it's worth now |
| 26 Feb 2026 | £123,000 |
No other historical records.
5, Bridge Road, Budleigh Salterton EX9 6EA
| Today | See what it's worth now |
| 25 Feb 2026 | £1,140,000 |
| 29 Jan 2014 | £740,000 |
No other historical records.
Anton Cottage, Boucher Way, Budleigh Salterton EX9 6HQ
| Today | See what it's worth now |
| 25 Feb 2026 | £1,050,000 |
| 12 Oct 2022 | £850,000 |
21, Vision Hill Road, Budleigh Salterton EX9 6ED
| Today | See what it's worth now |
| 25 Feb 2026 | £1,060,000 |
| 30 Apr 2015 | £570,000 |
No other historical records.
1, Forge Close, Budleigh Salterton EX9 6QY
| Today | See what it's worth now |
| 12 Feb 2026 | £360,000 |
| 4 Dec 2023 | £385,000 |
8, Garden Court Road, Budleigh Salterton EX9 6PN
| Today | See what it's worth now |
| 2 Feb 2026 | £460,000 |
| 17 Jul 2018 | £315,000 |
4c Winwood Cottage, Cricket Field Lane, Budleigh Salterton EX9 6SY
| Today | See what it's worth now |
| 2 Feb 2026 | £305,000 |
| 16 Nov 2005 | £215,000 |
No other historical records.
9, Victoria Place, Budleigh Salterton EX9 6JP
| Today | See what it's worth now |
| 19 Dec 2025 | £260,000 |
| 24 Nov 2023 | £155,000 |
No other historical records.
23, Stanley Mews, Station Road, Budleigh Salterton EX9 6RG
| Today | See what it's worth now |
| 12 Dec 2025 | £125,000 |
| 5 Aug 2022 | £115,000 |
6, Armytage Road, Budleigh Salterton EX9 6SD
| Today | See what it's worth now |
| 19 Nov 2025 | £285,000 |
| 1 Feb 2017 | £212,000 |
No other historical records.
28, Greenway Lane, Budleigh Salterton EX9 6SG
| Today | See what it's worth now |
| 19 Nov 2025 | £347,500 |
| 4 Nov 2020 | £280,000 |
17, Moormead, Budleigh Salterton EX9 6PZ
| Today | See what it's worth now |
| 18 Nov 2025 | £465,000 |
| 16 Mar 2022 | £429,250 |
3, Park Lane, Budleigh Salterton EX9 6QT
| Today | See what it's worth now |
| 12 Nov 2025 | £785,000 |
| 14 Aug 2014 | £620,000 |
27, West Hill, Budleigh Salterton EX9 6BU
| Today | See what it's worth now |
| 11 Nov 2025 | £900,000 |
| 28 May 1996 | £165,000 |
No other historical records.

Source Acknowledgement: © Crown copyright. England and Wales house price data is publicly available information produced by the HM Land Registry.This material was last updated on 9 July 2026. It covers the period from 1 January 1995 to 30 April 2026 and contains property transactions which have been registered during that period. Contains HM Land Registry data © Crown copyright and database right 2026. This data is licensed under the Open Government Licence v3.0.
Disclaimer: Rightmove.co.uk provides this HM Land Registry data "as is". The burden for fitness of the data relies completely with the user and is provided for informational purposes only. No warranty, express or implied, is given relating to the accuracy of content of the HM Land Registry data and Rightmove does not accept any liability for error or omission. If you have found an error with the data or need further information please contact HM Land Registry.
Permitted Use: Viewers of this Information are granted permission to access this Crown copyright material and to download it onto electronic, magnetic, optical or similar storage media provided that such activities are for private research, study or in-house use only. Any other use of the material requires the formal written permission of Land Registry which can be requested from us, and is subject to an additional licence and associated charge.
Rightmove takes no liability for your use of, or reliance on, Rightmove's Instant Valuation due to the limitations of our tracking tool listed here. Use of this tool is taken entirely at your own risk. All rights reserved.