
House Prices in Brixington
House prices in Brixington have an overall average of £328,040 over the last year.
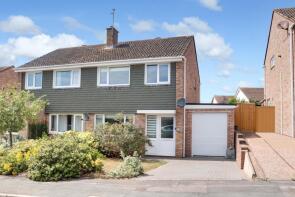
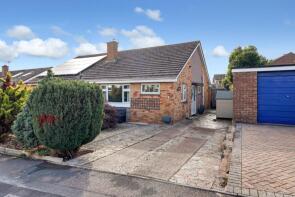
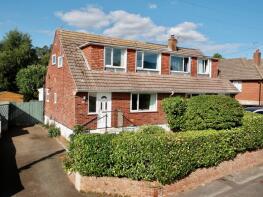
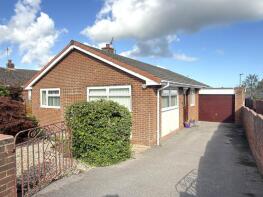
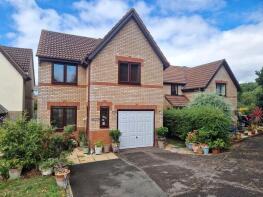
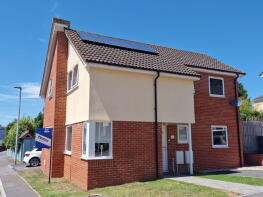
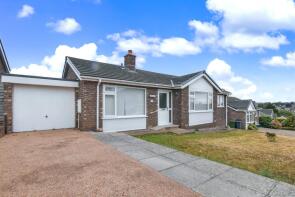
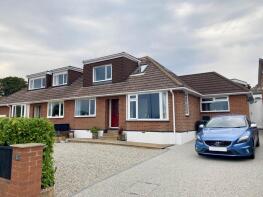
The majority of properties sold in Brixington during the last year were semi-detached properties, selling for an average price of £318,000. Detached properties sold for an average of £420,163, with terraced properties fetching £244,679.
Overall, the historical sold prices in Brixington over the last year were 2% down on the previous year and 10% down on the 2022 peak of £362,833.
Properties Sold
23, Martins Road, Exmouth EX8 4LN
| Today | See what it's worth now |
| 20 Mar 2026 | £252,500 |
| 26 Apr 1995 | £50,000 |
No other historical records.
31, Essington Close, Exmouth EX8 4QY
| Today | See what it's worth now |
| 20 Mar 2026 | £325,000 |
| 24 Nov 2009 | £199,950 |
7, The Copse, Exmouth EX8 4EY
| Today | See what it's worth now |
| 17 Mar 2026 | £240,000 |
| 19 Apr 2002 | £110,000 |
No other historical records.
2, Wade Close, Exmouth EX8 4RX
| Today | See what it's worth now |
| 13 Mar 2026 | £218,000 |
| 5 Dec 2014 | £155,000 |
4, Norman Close, Exmouth EX8 4JY
| Today | See what it's worth now |
| 12 Mar 2026 | £321,000 |
| 10 May 2024 | £321,000 |
4, Arthurs Close, Exmouth EX8 4JZ
| Today | See what it's worth now |
| 4 Mar 2026 | £280,000 |
| 11 Aug 2020 | £215,000 |
No other historical records.
8, Littlemead Lane, Exmouth EX8 4RE
| Today | See what it's worth now |
| 4 Mar 2026 | £395,000 |
| 4 Aug 2022 | £360,000 |
50, Brixington Lane, Exmouth EX8 4JG
| Today | See what it's worth now |
| 27 Feb 2026 | £352,000 |
| 5 Jul 2004 | £207,500 |
No other historical records.
24, Greenpark Road, Exmouth EX8 4JN
| Today | See what it's worth now |
| 27 Feb 2026 | £320,000 |
| 12 Jul 2013 | £174,000 |
No other historical records.
34, Langstone Drive, Exmouth EX8 4JA
| Today | See what it's worth now |
| 25 Feb 2026 | £190,000 |
| 10 Nov 2000 | £75,000 |
No other historical records.
21a, Martins Road, Exmouth EX8 4LN
| Today | See what it's worth now |
| 20 Feb 2026 | £262,500 |
| 25 Nov 2020 | £232,500 |
No other historical records.
26, Bradham Court, Exmouth EX8 4AN
| Today | See what it's worth now |
| 20 Feb 2026 | £138,000 |
| 5 Apr 2019 | £85,000 |
41, Broadmead, Exmouth EX8 4JR

| Today | See what it's worth now |
| 19 Feb 2026 | £180,000 |
| 29 Jul 2024 | £170,000 |
21, Linden Close, Exmouth EX8 4JW

| Today | See what it's worth now |
| 10 Feb 2026 | £280,000 |
| 21 Nov 1997 | £58,000 |
No other historical records.
81, Valley Way, Exmouth EX8 4RL
| Today | See what it's worth now |
| 2 Feb 2026 | £363,000 |
| 6 Dec 2019 | £322,000 |
47, Cheriswood Avenue, Exmouth EX8 4HG
| Today | See what it's worth now |
| 1 Feb 2026 | £255,000 |
| 20 Apr 1999 | £72,500 |
37, Meadow View Road, Exmouth EX8 4HB
| Today | See what it's worth now |
| 30 Jan 2026 | £300,000 |
| 2 Oct 2020 | £234,500 |
46, St Johns Road, Exmouth EX8 4BY
| Today | See what it's worth now |
| 28 Jan 2026 | £345,000 |
No other historical records.
9, Cheriswood Avenue, Exmouth EX8 4HG
| Today | See what it's worth now |
| 20 Jan 2026 | £370,000 |
| 16 Jan 2020 | £320,000 |
22, Marcus Road, Exmouth EX8 4DB
| Today | See what it's worth now |
| 15 Jan 2026 | £415,000 |
| 20 Sep 2016 | £300,000 |
No other historical records.
22, Brixington Lane, Exmouth EX8 4HN
| Today | See what it's worth now |
| 9 Jan 2026 | £354,000 |
| 14 Dec 2016 | £275,000 |
No other historical records.
2, Swiss Close, Exmouth EX8 4QF
| Today | See what it's worth now |
| 8 Jan 2026 | £425,000 |
| 17 Nov 2023 | £390,000 |
121, Hulham Road, Exmouth EX8 4QZ
| Today | See what it's worth now |
| 7 Jan 2026 | £540,000 |
| 23 Sep 2022 | £640,000 |

Source Acknowledgement: © Crown copyright. England and Wales house price data is publicly available information produced by the HM Land Registry.This material was last updated on 9 July 2026. It covers the period from 1 January 1995 to 30 April 2026 and contains property transactions which have been registered during that period. Contains HM Land Registry data © Crown copyright and database right 2026. This data is licensed under the Open Government Licence v3.0.
Disclaimer: Rightmove.co.uk provides this HM Land Registry data "as is". The burden for fitness of the data relies completely with the user and is provided for informational purposes only. No warranty, express or implied, is given relating to the accuracy of content of the HM Land Registry data and Rightmove does not accept any liability for error or omission. If you have found an error with the data or need further information please contact HM Land Registry.
Permitted Use: Viewers of this Information are granted permission to access this Crown copyright material and to download it onto electronic, magnetic, optical or similar storage media provided that such activities are for private research, study or in-house use only. Any other use of the material requires the formal written permission of Land Registry which can be requested from us, and is subject to an additional licence and associated charge.
Rightmove takes no liability for your use of, or reliance on, Rightmove's Instant Valuation due to the limitations of our tracking tool listed here. Use of this tool is taken entirely at your own risk. All rights reserved.