
House Prices in Sunderland (district of)
House prices in Sunderland (district of) have an overall average of £176,576 over the last year.
The majority of properties sold in Sunderland (district of) during the last year were semi-detached properties, selling for an average price of £178,444. Terraced properties sold for an average of £133,547, with detached properties fetching £308,078.
Overall, the historical sold prices in Sunderland (district of) over the last year were 6% down on the previous year and similar to the 2022 peak of £176,701.
Properties Sold
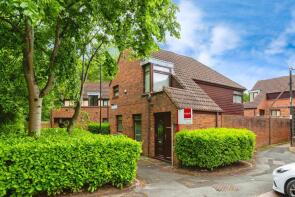
49, Warwick Street, Sunderland SR5 1DL
| Today | See what it's worth now |
| 27 Apr 2026 | £134,950 |
| 26 Apr 2019 | £107,000 |
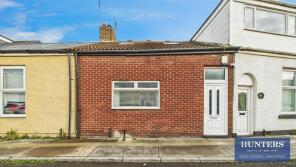
28, Dene Street, Pallion, Sunderland SR4 6JB
| Today | See what it's worth now |
| 26 Apr 2026 | £90,000 |
| 26 Nov 2021 | £77,500 |
59, Addison Road, East Boldon NE36 0QZ
| Today | See what it's worth now |
| 24 Apr 2026 | £135,000 |
| 15 Feb 2019 | £80,000 |
No other historical records.
11, Victoria Terrace, East Boldon NE36 0RS
| Today | See what it's worth now |
| 24 Apr 2026 | £124,500 |
| 26 Jul 2001 | £95,000 |
No other historical records.
6, Station Road North, Seaham SR7 9RR
| Today | See what it's worth now |
| 24 Apr 2026 | £99,950 |
| 18 Apr 2017 | £74,000 |
1, Prospect Terrace, Eighton Banks, Gateshead NE9 7YE
| Today | See what it's worth now |
| 24 Apr 2026 | £210,000 |
| 29 Sep 2017 | £167,000 |
43, Mulberry Avenue, Sunderland SR5 5AZ
| Today | See what it's worth now |
| 24 Apr 2026 | £115,000 |
| 21 May 2024 | £120,000 |
6, Conica Lane, Philadelphia, Houghton-le-spring DH4 4FH
| Today | See what it's worth now |
| 24 Apr 2026 | £247,999 |
| 20 Dec 2024 | £218,452 |
No other historical records.
7a Woodlands, The Village, Ryhope, Sunderland SR2 0NQ

| Today | See what it's worth now |
| 24 Apr 2026 | £318,500 |
| 6 Nov 1995 | £52,000 |
No other historical records.
67, Houghton Road, Hetton-le-hole, Houghton Le Spring DH5 9PQ
| Today | See what it's worth now |
| 23 Apr 2026 | £135,000 |
| 8 Apr 2004 | £65,000 |
No other historical records.
13, Trotter Terrace, Sunderland SR2 0LA
| Today | See what it's worth now |
| 23 Apr 2026 | £95,000 |
| 17 Jun 2024 | £93,000 |
13, Curlew Close, Ayton, Washington NE38 0EH
| Today | See what it's worth now |
| 22 Apr 2026 | £153,000 |
| 5 Dec 2023 | £138,000 |
No other historical records.
26, Ailesbury Street, Sunderland SR4 6EW
| Today | See what it's worth now |
| 21 Apr 2026 | £80,000 |
| 15 Feb 2019 | £54,000 |
95, Gleneagles Road, Sunderland SR4 8JF
| Today | See what it's worth now |
| 17 Apr 2026 | £108,000 |
| 4 Dec 2013 | £76,000 |
7, Wallis Street, Penshaw, Houghton Le Spring DH4 7HB
| Today | See what it's worth now |
| 17 Apr 2026 | £117,500 |
| 15 Aug 2019 | £83,500 |
29, Nye Dene, Sunderland SR5 3DP
| Today | See what it's worth now |
| 17 Apr 2026 | £120,000 |
| 7 Nov 2003 | £62,950 |
24, Lawnswood, Houghton Le Spring DH5 8JB
| Today | See what it's worth now |
| 17 Apr 2026 | £145,000 |
| 18 Dec 2019 | £130,000 |
12, Station Terrace, Sulgrave, Washington NE37 3AJ
| Today | See what it's worth now |
| 17 Apr 2026 | £105,000 |
| 12 Apr 2007 | £90,000 |
16, Borrowdale, Albany, Washington NE37 1QE
| Today | See what it's worth now |
| 17 Apr 2026 | £85,000 |
| 17 Oct 2003 | £67,000 |
13, Hillview Grove, Houghton Le Spring DH4 4SL

| Today | See what it's worth now |
| 17 Apr 2026 | £165,000 |
| 19 May 2011 | £136,500 |
30, Dacre Road, Sunderland SR6 8EL
| Today | See what it's worth now |
| 17 Apr 2026 | £208,000 |
| 29 Apr 2022 | £210,000 |
21, Haydon, Washington NE38 8PF
| Today | See what it's worth now |
| 16 Apr 2026 | £299,950 |
No other historical records.
3, Tollerton Drive, Castletown, Sunderland SR5 3DQ
| Today | See what it's worth now |
| 16 Apr 2026 | £300,000 |
| 20 Jun 2003 | £157,000 |
No other historical records.

Source Acknowledgement: © Crown copyright. England and Wales house price data is publicly available information produced by the HM Land Registry.This material was last updated on 9 July 2026. It covers the period from 1 January 1995 to 30 April 2026 and contains property transactions which have been registered during that period. Contains HM Land Registry data © Crown copyright and database right 2026. This data is licensed under the Open Government Licence v3.0.
Disclaimer: Rightmove.co.uk provides this HM Land Registry data "as is". The burden for fitness of the data relies completely with the user and is provided for informational purposes only. No warranty, express or implied, is given relating to the accuracy of content of the HM Land Registry data and Rightmove does not accept any liability for error or omission. If you have found an error with the data or need further information please contact HM Land Registry.
Permitted Use: Viewers of this Information are granted permission to access this Crown copyright material and to download it onto electronic, magnetic, optical or similar storage media provided that such activities are for private research, study or in-house use only. Any other use of the material requires the formal written permission of Land Registry which can be requested from us, and is subject to an additional licence and associated charge.
Rightmove takes no liability for your use of, or reliance on, Rightmove's Instant Valuation due to the limitations of our tracking tool listed here. Use of this tool is taken entirely at your own risk. All rights reserved.