
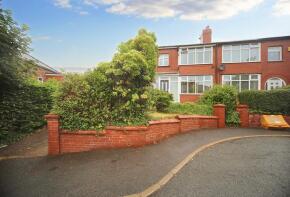
House Prices in Swinley
House prices in Swinley have an overall average of £212,035 over the last year.
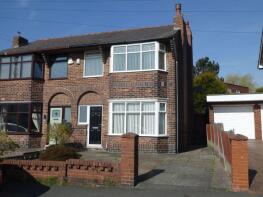
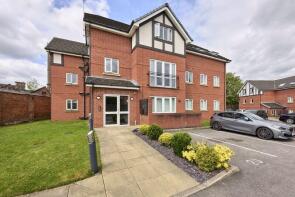
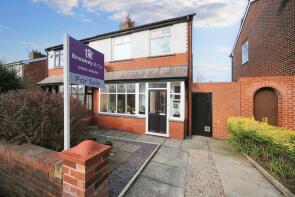
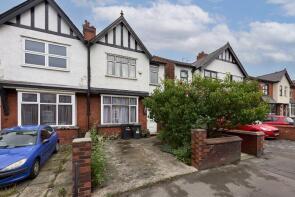
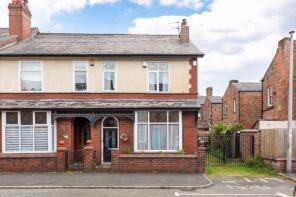
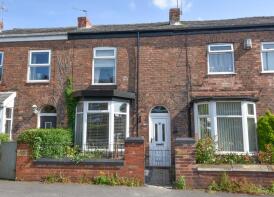
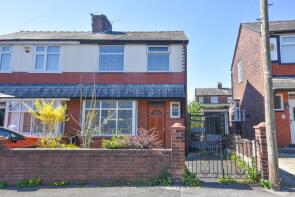
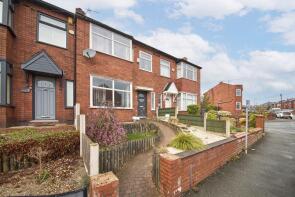
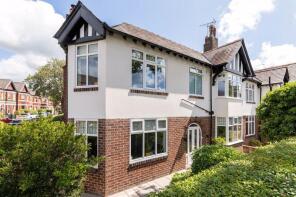
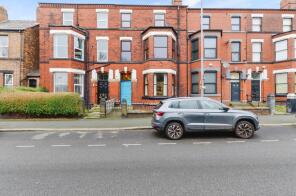
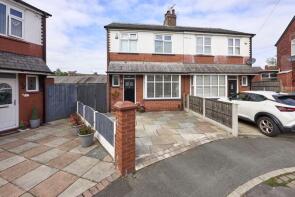
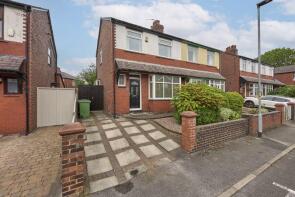
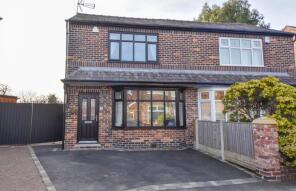
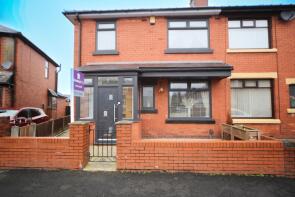
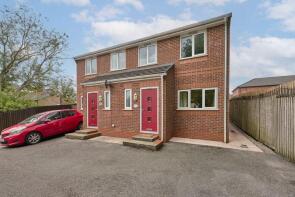
The majority of properties sold in Swinley during the last year were semi-detached properties, selling for an average price of £242,179. Terraced properties sold for an average of £168,167, with flats fetching £118,500.
Overall, the historical sold prices in Swinley over the last year were 10% down on the previous year and 5% down on the 2022 peak of £222,412.
Properties Sold
8, Cartmel Avenue, Wigan WN1 2HD
| Today | See what it's worth now |
| 19 Mar 2026 | £185,000 |
No other historical records.
20, Gemini Court, Walkden Avenue, Wigan WN1 2JN
| Today | See what it's worth now |
| 13 Mar 2026 | £135,000 |
| 19 Jan 2015 | £110,000 |
5, Goldenways, Wigan WN1 2EA
| Today | See what it's worth now |
| 12 Mar 2026 | £215,000 |
| 26 Feb 2016 | £136,500 |
Flat B5, Monument Mansions, Wigan Lane, Wigan WN1 2LE

| Today | See what it's worth now |
| 6 Mar 2026 | £77,500 |
| 5 Mar 2013 | £56,250 |
28, Kenyon Road, Wigan WN1 2DQ
| Today | See what it's worth now |
| 27 Feb 2026 | £225,000 |
No other historical records.
21, Swinley Street, Wigan WN1 2ED
| Today | See what it's worth now |
| 26 Feb 2026 | £265,000 |
| 30 Jul 2021 | £220,000 |
16, Eccleston Street, Wigan WN1 2AY
| Today | See what it's worth now |
| 9 Feb 2026 | £287,000 |
| 8 Feb 2001 | £76,500 |
No other historical records.
38, Upper Dicconson Street, Wigan WN1 2AG

| Today | See what it's worth now |
| 9 Feb 2026 | £189,950 |
| 29 Apr 2024 | £185,000 |
12, Swinley Street, Wigan WN1 2ED
| Today | See what it's worth now |
| 6 Feb 2026 | £182,000 |
| 28 Sep 2010 | £110,000 |
13, Goldenways, Wigan WN1 2EA
| Today | See what it's worth now |
| 6 Feb 2026 | £160,000 |
No other historical records.
8, Queensway, Wigan WN1 2JA
| Today | See what it's worth now |
| 2 Feb 2026 | £152,000 |
| 28 Nov 2018 | £120,000 |
45, Trafalgar Road, Wigan WN1 2BB
| Today | See what it's worth now |
| 30 Jan 2026 | £325,000 |
| 4 May 2018 | £208,000 |
3, Mabs Cross Court, Wigan WN1 1ZL

| Today | See what it's worth now |
| 23 Jan 2026 | £110,000 |
| 12 Aug 2008 | £105,000 |
No other historical records.
28, Swinley Road, Wigan WN1 2DN
| Today | See what it's worth now |
| 22 Jan 2026 | £280,000 |
| 12 Feb 2024 | £230,000 |
No other historical records.
18, Avondale Road, Wigan WN1 2BE
| Today | See what it's worth now |
| 20 Jan 2026 | £192,000 |
| 19 Nov 2009 | £195,000 |
8, Silverdale, Wigan WN1 2DY
| Today | See what it's worth now |
| 16 Jan 2026 | £226,000 |
| 31 Mar 2022 | £240,000 |
9, Copperfield, Wigan WN1 2DZ
| Today | See what it's worth now |
| 9 Jan 2026 | £205,000 |
| 16 Dec 2013 | £142,500 |
34, Lessingham Avenue, Wigan WN1 2HX
| Today | See what it's worth now |
| 19 Dec 2025 | £247,950 |
| 18 Sep 2020 | £145,000 |
No other historical records.
7, Heeley Street, Wigan WN1 2HN
| Today | See what it's worth now |
| 18 Dec 2025 | £215,000 |
| 31 Oct 2019 | £170,000 |
No other historical records.
16b, Douglas Road, Wigan WN1 1XT
| Today | See what it's worth now |
| 18 Dec 2025 | £200,000 |
| 8 Apr 2021 | £160,000 |
13, Charles Street, Wigan WN1 2BP

| Today | See what it's worth now |
| 12 Dec 2025 | £165,000 |
| 11 Jan 2010 | £110,000 |
No other historical records.
104, Swinley Lane, Wigan WN1 2EF
| Today | See what it's worth now |
| 12 Dec 2025 | £305,000 |
| 13 Sep 2017 | £235,000 |
9, Ashland Avenue, Wigan WN1 2DP
| Today | See what it's worth now |
| 28 Nov 2025 | £87,501 |
| 5 Sep 2005 | £80,000 |
No other historical records.
Source Acknowledgement: © Crown copyright. England and Wales house price data is publicly available information produced by the HM Land Registry.This material was last updated on 9 July 2026. It covers the period from 1 January 1995 to 30 April 2026 and contains property transactions which have been registered during that period. Contains HM Land Registry data © Crown copyright and database right 2026. This data is licensed under the Open Government Licence v3.0.
Disclaimer: Rightmove.co.uk provides this HM Land Registry data "as is". The burden for fitness of the data relies completely with the user and is provided for informational purposes only. No warranty, express or implied, is given relating to the accuracy of content of the HM Land Registry data and Rightmove does not accept any liability for error or omission. If you have found an error with the data or need further information please contact HM Land Registry.
Permitted Use: Viewers of this Information are granted permission to access this Crown copyright material and to download it onto electronic, magnetic, optical or similar storage media provided that such activities are for private research, study or in-house use only. Any other use of the material requires the formal written permission of Land Registry which can be requested from us, and is subject to an additional licence and associated charge.
Rightmove takes no liability for your use of, or reliance on, Rightmove's Instant Valuation due to the limitations of our tracking tool listed here. Use of this tool is taken entirely at your own risk. All rights reserved.