
House Prices in SY10
House prices in SY10 have an overall average of £359,913 over the last year.
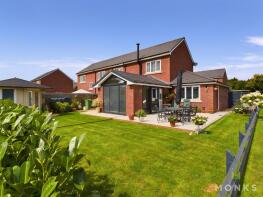
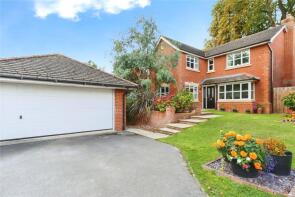
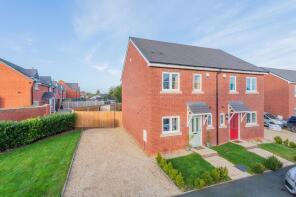
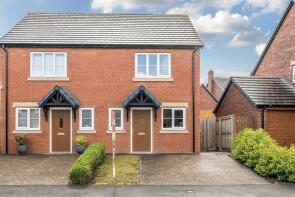
The majority of properties sold in SY10 during the last year were detached properties, selling for an average price of £443,990. Semi-detached properties sold for an average of £204,845, with terraced properties fetching £235,097.
Overall, the historical sold prices in SY10 over the last year were 1% up on the previous year and 8% up on the 2022 peak of £332,597.
Properties Sold
Ty Ddraig, Main Street, Oswestry SY10 9AY

| Today | See what it's worth now |
| 10 Apr 2026 | £557,500 |
| 29 Oct 2007 | £350,000 |
Pinewood, Croeswylan Lane, Oswestry SY10 9PN
| Today | See what it's worth now |
| 8 Apr 2026 | £425,000 |
| 13 Aug 2004 | £265,000 |
9 Gwynfan, Croeswylan Lane, Oswestry SY10 9PN

| Today | See what it's worth now |
| 27 Mar 2026 | £462,500 |
| 13 Aug 2021 | £355,000 |
No other historical records.
Extensions and planning permission in SY10
See planning approval stats, extension build costs and value added estimates.

6, Offas Close, Oswestry SY10 9NG

| Today | See what it's worth now |
| 27 Mar 2026 | £495,000 |
| 2 Jun 2016 | £300,000 |
49, Cae Onan, Oswestry SY10 9PX

| Today | See what it's worth now |
| 27 Mar 2026 | £275,000 |
| 20 Nov 2020 | £207,000 |
Wood Cottage, Maesbrook Junction Post Office To Whip Lane End Of Woolston, Oswestry SY10 8QS

| Today | See what it's worth now |
| 27 Mar 2026 | £560,000 |
| 7 Oct 2014 | £410,000 |
Deane House, Chapel Lane, Oswestry SY10 8ED
| Today | See what it's worth now |
| 25 Mar 2026 | £711,250 |
| 31 Jul 2002 | £295,000 |
Rhos Cottage, Quinta Park Boundary Road, Quinta, Oswestry SY10 7LW
| Today | See what it's worth now |
| 24 Mar 2026 | £435,000 |
| 10 Jun 2020 | £325,000 |
No 4 Daywell Cottage, Daywell Junction At Ford At River Perry, Daywell, Gobowen SY10 7EL
| Today | See what it's worth now |
| 24 Mar 2026 | £152,000 |
| 17 Dec 2021 | £150,000 |
1, Powys Terrace, Llanrhaeadr-ym-mochnant, Oswestry SY10 0JS
| Today | See what it's worth now |
| 23 Mar 2026 | £225,000 |
| 3 Apr 2018 | £148,000 |
15, Moors Bank, St. Martins, St Martins SY10 7BG
| Today | See what it's worth now |
| 12 Mar 2026 | £130,000 |
No other historical records.
Wellfield, Entrance To Trafford Lodge To Chapel Lane Start, Dovaston, Oswestry SY10 8DP

| Today | See what it's worth now |
| 9 Mar 2026 | £510,000 |
| 24 Jul 2003 | £184,000 |
No other historical records.
The Pines, Chapel Lane To Knockin Heath Crossroads B4396, Oswestry SY10 8EA
| Today | See what it's worth now |
| 6 Mar 2026 | £545,000 |
| 18 Aug 2021 | £495,000 |
35, Milars Field, Oswestry SY10 9PU
| Today | See what it's worth now |
| 4 Mar 2026 | £230,000 |
| 1 Jul 2019 | £140,000 |
No other historical records.
21, Milars Field, Oswestry SY10 9PU
| Today | See what it's worth now |
| 4 Mar 2026 | £380,000 |
| 13 Mar 2008 | £295,950 |
No other historical records.
4, Glanrafon, Llanwddyn, Oswestry SY10 0LU

| Today | See what it's worth now |
| 3 Mar 2026 | £205,000 |
| 13 Mar 2023 | £140,000 |
12, Garside Close, Oswestry SY10 7FA
| Today | See what it's worth now |
| 27 Feb 2026 | £312,500 |
| 10 Dec 2019 | £218,000 |
No other historical records.
18, St Annes Drive, Oswestry SY10 9LU
| Today | See what it's worth now |
| 20 Feb 2026 | £420,000 |
| 7 Oct 2021 | £365,000 |
4, Dol Emrys, B4396 From Junction With C2200 To Junction With C2003, Pen-y-bont, Oswestry SY10 9JL

| Today | See what it's worth now |
| 19 Feb 2026 | £220,000 |
| 15 Feb 2013 | £107,500 |
No other historical records.
Tynygroes, C2206 From Junction With C2205 To Junction With U5155, Rhiwlas, Oswestry SY10 7JH

| Today | See what it's worth now |
| 17 Feb 2026 | £825,000 |
| 31 May 2017 | £595,000 |
No other historical records.
4, Garside Close, Oswestry SY10 7FA
| Today | See what it's worth now |
| 16 Feb 2026 | £187,000 |
| 8 Nov 2019 | £157,500 |
No other historical records.
40, Kingfisher Way, Oswestry SY10 9LX
| Today | See what it's worth now |
| 11 Feb 2026 | £186,750 |
| 31 Jul 2019 | £170,000 |
No other historical records.
Kappara, Spring Bank, Oswestry SY10 9DJ
| Today | See what it's worth now |
| 11 Feb 2026 | £582,000 |
| 23 May 2018 | £350,000 |

Source Acknowledgement: © Crown copyright. England and Wales house price data is publicly available information produced by the HM Land Registry.This material was last updated on 9 July 2026. It covers the period from 1 January 1995 to 30 April 2026 and contains property transactions which have been registered during that period. Contains HM Land Registry data © Crown copyright and database right 2026. This data is licensed under the Open Government Licence v3.0.
Disclaimer: Rightmove.co.uk provides this HM Land Registry data "as is". The burden for fitness of the data relies completely with the user and is provided for informational purposes only. No warranty, express or implied, is given relating to the accuracy of content of the HM Land Registry data and Rightmove does not accept any liability for error or omission. If you have found an error with the data or need further information please contact HM Land Registry.
Permitted Use: Viewers of this Information are granted permission to access this Crown copyright material and to download it onto electronic, magnetic, optical or similar storage media provided that such activities are for private research, study or in-house use only. Any other use of the material requires the formal written permission of Land Registry which can be requested from us, and is subject to an additional licence and associated charge.
Rightmove takes no liability for your use of, or reliance on, Rightmove's Instant Valuation due to the limitations of our tracking tool listed here. Use of this tool is taken entirely at your own risk. All rights reserved.