
House Prices in Tanglwst
House prices in Tanglwst have an overall average of £252,344 over the last year.
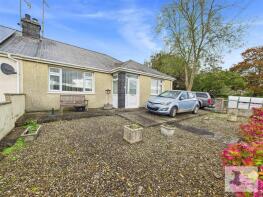
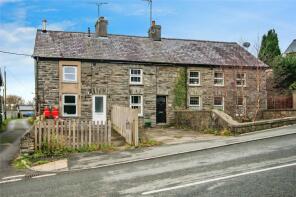
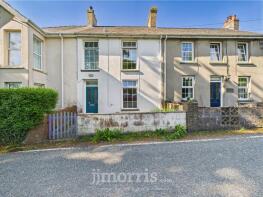
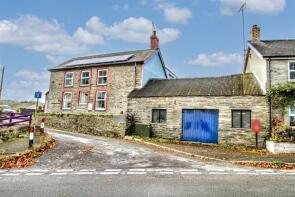
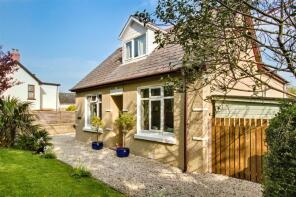
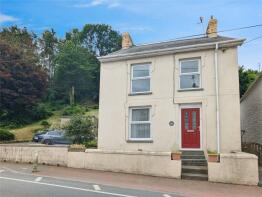
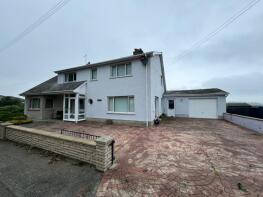
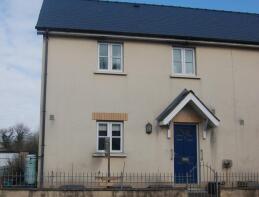
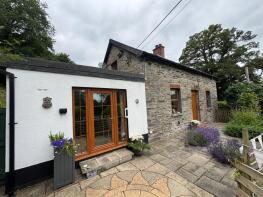
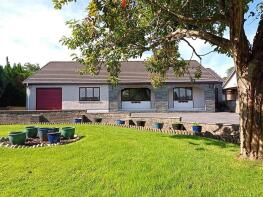
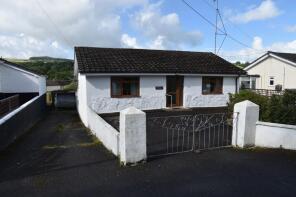
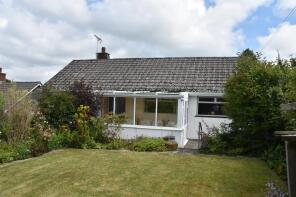
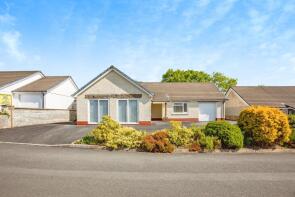
The majority of properties sold in Tanglwst during the last year were detached properties, selling for an average price of £282,717. Terraced properties sold for an average of £178,500, with semi-detached properties fetching £170,000.
Overall, the historical sold prices in Tanglwst over the last year were 14% down on the previous year and 17% down on the 2022 peak of £305,762.
Properties Sold
5, Derwen Gardens, Newcastle Emlyn SA38 9NX
| Today | See what it's worth now |
| 24 Apr 2026 | £165,000 |
| 1 Jun 2012 | £123,000 |
Wern Cottage, Station Road, Newcastle Emlyn SA38 9BX

| Today | See what it's worth now |
| 27 Mar 2026 | £165,000 |
No other historical records.
2, Coedmor Terrace, B4571 From Newcastle Emlyn To The Entrance Of Blaenant, Newcastle Emlyn SA38 9DS
| Today | See what it's worth now |
| 13 Mar 2026 | £100,000 |
| 28 Jun 2002 | £45,000 |
Maesygraig, Cwm Cou SA38 9PE
| Today | See what it's worth now |
| 25 Feb 2026 | £120,000 |
| 23 Jun 2014 | £80,000 |
No other historical records.
Yr Hen Efail, Cwm Cou SA38 9PB
| Today | See what it's worth now |
| 19 Feb 2026 | £375,000 |
| 29 Nov 2012 | £212,500 |
No other historical records.
Parc Y Dwr, U5450 From, Capel Iwan, Newcastle Emlyn SA38 9LT

| Today | See what it's worth now |
| 19 Feb 2026 | £330,000 |
| 23 Oct 2020 | £241,000 |
Hephzibah, Beulah SA38 9QB
| Today | See what it's worth now |
| 16 Jan 2026 | £595,000 |
| 25 Apr 2008 | £385,000 |
2, Ebenezer Street, Newcastle Emlyn SA38 9BS
| Today | See what it's worth now |
| 16 Jan 2026 | £147,500 |
| 2 Dec 2021 | £120,000 |
No other historical records.
Klanna, C1290 From Capel Iwan Road To Junc B4333, Capel Iwan, Newcastle Emlyn SA38 9LU
| Today | See what it's worth now |
| 5 Jan 2026 | £329,000 |
| 13 Jun 2017 | £232,500 |
Efor Grug, Cwm Cou SA38 9PF
| Today | See what it's worth now |
| 19 Dec 2025 | £290,000 |
| 18 Oct 1995 | £85,500 |
No other historical records.
Hirwenydd, Beulah SA38 9QB
| Today | See what it's worth now |
| 18 Dec 2025 | £330,000 |
| 15 Mar 2002 | £60,000 |
No other historical records.
Fron Helyg, Aberarad, Newcastle Emlyn SA38 9DQ
| Today | See what it's worth now |
| 18 Dec 2025 | £140,000 |
No other historical records.
Murmur Y Ceri, Blaen-cil-llech, Llandyfriog SA38 9EP
| Today | See what it's worth now |
| 16 Dec 2025 | £315,000 |
No other historical records.
1, Swn Yr Afon, Newcastle Emlyn SA38 9BR
| Today | See what it's worth now |
| 11 Dec 2025 | £190,000 |
| 14 Nov 2008 | £159,850 |
No other historical records.
Rhydhalen, Newcastle Emlyn To Pentrecagal, Newcastle Emlyn SA38 9HS
| Today | See what it's worth now |
| 10 Dec 2025 | £285,000 |
| 21 Aug 2015 | £175,000 |
No other historical records.
Maes Y Fron, From Newcastle Emlyn To Cenarth, Newcastle Emlyn SA38 9RA
| Today | See what it's worth now |
| 5 Dec 2025 | £300,000 |
| 29 May 2002 | £144,000 |
Brynhedyn, Cwm Cou SA38 9PF
| Today | See what it's worth now |
| 31 Oct 2025 | £330,000 |
| 21 Sep 2022 | £325,000 |
3, Teifi Terrace, Adpar SA38 9EA
| Today | See what it's worth now |
| 31 Oct 2025 | £150,000 |
| 1 Nov 2012 | £81,500 |
No other historical records.
Yr Encil, Lloyd Terrace, Adpar SA38 9NT
| Today | See what it's worth now |
| 7 Oct 2025 | £218,000 |
No other historical records.
Brynhaf, Penlon Road, Newcastle Emlyn SA38 9HR
| Today | See what it's worth now |
| 26 Sep 2025 | £155,000 |
No other historical records.
12 Llyswen, Bro Gorwel, Newcastle Emlyn SA38 9PJ
| Today | See what it's worth now |
| 25 Sep 2025 | £305,000 |
| 30 Oct 1998 | £85,000 |
No other historical records.
Elmgrove, Lloyd Terrace, Adpar SA38 9NT
| Today | See what it's worth now |
| 19 Sep 2025 | £220,000 |
No other historical records.
Gwyn Villa, C1291 From, Capel Iwan, Newcastle Emlyn SA38 9ND
| Today | See what it's worth now |
| 5 Sep 2025 | £190,000 |
| 29 Jun 2006 | £125,000 |
Source Acknowledgement: © Crown copyright. England and Wales house price data is publicly available information produced by the HM Land Registry.This material was last updated on 9 July 2026. It covers the period from 1 January 1995 to 30 April 2026 and contains property transactions which have been registered during that period. Contains HM Land Registry data © Crown copyright and database right 2026. This data is licensed under the Open Government Licence v3.0.
Disclaimer: Rightmove.co.uk provides this HM Land Registry data "as is". The burden for fitness of the data relies completely with the user and is provided for informational purposes only. No warranty, express or implied, is given relating to the accuracy of content of the HM Land Registry data and Rightmove does not accept any liability for error or omission. If you have found an error with the data or need further information please contact HM Land Registry.
Permitted Use: Viewers of this Information are granted permission to access this Crown copyright material and to download it onto electronic, magnetic, optical or similar storage media provided that such activities are for private research, study or in-house use only. Any other use of the material requires the formal written permission of Land Registry which can be requested from us, and is subject to an additional licence and associated charge.
Rightmove takes no liability for your use of, or reliance on, Rightmove's Instant Valuation due to the limitations of our tracking tool listed here. Use of this tool is taken entirely at your own risk. All rights reserved.