
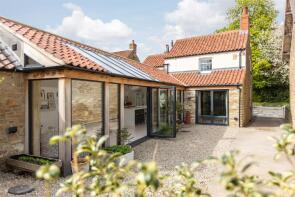
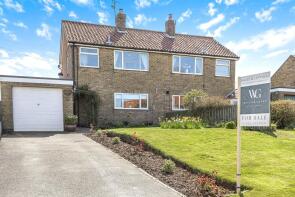
House Prices in Terrington
House prices in Terrington have an overall average of £538,333 over the last year.
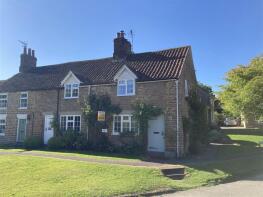
The majority of properties sold in Terrington during the last year were detached properties, selling for an average price of £675,000. Terraced properties sold for an average of £265,000.
Overall, the historical sold prices in Terrington over the last year were 70% up on the previous year and 37% down on the 2022 peak of £850,000.
Properties Sold
Crossways, Main Street, Terrington, York YO60 6PT
| Today | See what it's worth now |
| 23 Jan 2026 | £265,000 |
| 14 Mar 2018 | £200,500 |
The Coach House, South Back Lane, York YO60 6PX
| Today | See what it's worth now |
| 26 Nov 2025 | £720,000 |
| 7 Jul 2009 | £545,000 |
No other historical records.
Barn House, South Back Lane, York YO60 6PX
| Today | See what it's worth now |
| 1 Oct 2025 | £630,000 |
| 28 Sep 2020 | £475,000 |
Ebor House, Main Street, Terrington YO60 6PP

| Today | See what it's worth now |
| 11 Jun 2025 | £325,000 |
No other historical records.
Fourwinds, Highfield Cottages, North Back Lane, Terrington YO60 6NS
| Today | See what it's worth now |
| 12 May 2025 | £395,000 |
| 21 Jul 2005 | £175,000 |
No other historical records.
3, Flatt Top Cottages, Flat Top Farm Road, Terrington, York YO60 6PB
| Today | See what it's worth now |
| 12 Dec 2024 | £175,000 |
| 3 Mar 2015 | £96,500 |
Hollydene, Main Street, Terrington YO60 6PT

| Today | See what it's worth now |
| 31 Oct 2024 | £285,000 |
No other historical records.
1, South Crescent, South Back Lane, York YO60 6QA

| Today | See what it's worth now |
| 13 Sep 2024 | £290,000 |
| 29 Oct 2015 | £182,000 |
No other historical records.
Stone Haven, Mowthorpe Lane, Terrington YO60 6PZ
| Today | See what it's worth now |
| 8 Aug 2024 | £435,000 |
No other historical records.
Pear Tree House, South Back Lane, Terrington YO60 6PX
| Today | See what it's worth now |
| 9 Feb 2024 | £650,000 |
No other historical records.
2, Cliffe Mews, Cliffe Lane, York YO60 6PW
| Today | See what it's worth now |
| 15 Dec 2023 | £515,000 |
| 9 Mar 2003 | £295,000 |
No other historical records.
Chantry Cottage, Main Street, Terrington, York YO60 6PT
| Today | See what it's worth now |
| 1 Jul 2022 | £850,000 |
| 29 Jul 2016 | £435,000 |
13, South Back Lane, York YO60 6PX
| Today | See what it's worth now |
| 20 Aug 2021 | £290,000 |
| 12 Aug 2016 | £236,000 |
The Lodge, Main Street, Terrington, York YO60 6QB

| Today | See what it's worth now |
| 29 Jun 2021 | £1,600,000 |
| 18 Dec 2015 | £935,000 |
Green Acres, Flat Top Farm Road, Terrington, York YO60 6PA

| Today | See what it's worth now |
| 24 Mar 2021 | £425,000 |
No other historical records.
4 Pantiles, North Carr, Terrington, York YO60 6PN
| Today | See what it's worth now |
| 5 Feb 2021 | £480,000 |
| 28 Jan 2014 | £340,000 |
Columbine Cottage, Main Street, Terrington, York YO60 6PU
| Today | See what it's worth now |
| 14 Dec 2020 | £475,000 |
| 24 Oct 2003 | £295,000 |
5, Cliffe Mews, Cliffe Lane, York YO60 6PW

| Today | See what it's worth now |
| 11 Dec 2020 | £775,000 |
| 27 Jan 2005 | £550,000 |
No other historical records.
Chestnut House, South Back Lane, York YO60 6PX

| Today | See what it's worth now |
| 23 Oct 2020 | £499,950 |
| 21 Sep 2017 | £490,000 |
Field Cottage, Mowthorpe Lane, York YO60 6PT

| Today | See what it's worth now |
| 27 Feb 2020 | £185,000 |
No other historical records.
Auckland Cottage, Mowthorpe Lane, York YO60 6PT

| Today | See what it's worth now |
| 20 Dec 2019 | £225,000 |
No other historical records.
Gardeners Cottage, Church Lane, York YO60 6PS

| Today | See what it's worth now |
| 14 Mar 2019 | £280,000 |
| 12 Aug 2011 | £179,950 |
No other historical records.
19 Stonegarth, South Back Lane, York YO60 6PX

| Today | See what it's worth now |
| 12 Dec 2018 | £495,000 |
No other historical records.

Source Acknowledgement: © Crown copyright. England and Wales house price data is publicly available information produced by the HM Land Registry.This material was last updated on 9 July 2026. It covers the period from 1 January 1995 to 30 April 2026 and contains property transactions which have been registered during that period. Contains HM Land Registry data © Crown copyright and database right 2026. This data is licensed under the Open Government Licence v3.0.
Disclaimer: Rightmove.co.uk provides this HM Land Registry data "as is". The burden for fitness of the data relies completely with the user and is provided for informational purposes only. No warranty, express or implied, is given relating to the accuracy of content of the HM Land Registry data and Rightmove does not accept any liability for error or omission. If you have found an error with the data or need further information please contact HM Land Registry.
Permitted Use: Viewers of this Information are granted permission to access this Crown copyright material and to download it onto electronic, magnetic, optical or similar storage media provided that such activities are for private research, study or in-house use only. Any other use of the material requires the formal written permission of Land Registry which can be requested from us, and is subject to an additional licence and associated charge.
Rightmove takes no liability for your use of, or reliance on, Rightmove's Instant Valuation due to the limitations of our tracking tool listed here. Use of this tool is taken entirely at your own risk. All rights reserved.