
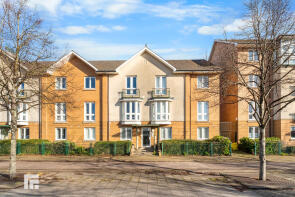
House Prices in The Exchange
House prices in The Exchange have an overall average of £209,532 over the last year.
The majority of properties sold in The Exchange during the last year were flats, selling for an average price of £187,097. Terraced properties sold for an average of £321,111, with semi-detached properties fetching £250,125.
Overall, the historical sold prices in The Exchange over the last year were 8% up on the previous year and 7% up on the 2022 peak of £196,005.
Properties Sold
130, Henke Court, Butetown, Cardiff CF10 4EJ

| Today | See what it's worth now |
| 8 Apr 2026 | £215,000 |
| 8 Sep 2021 | £175,000 |
6, Edward England Wharf, Lloyd George Avenue, Butetown, Cardiff CF10 4QL
| Today | See what it's worth now |
| 2 Apr 2026 | £148,600 |
| 3 Mar 2022 | £160,000 |
35, Moorby Court, Craiglee Drive, Butetown, Cardiff CF10 4BT
| Today | See what it's worth now |
| 2 Apr 2026 | £208,000 |
| 28 Apr 2004 | £125,000 |
184, Adventurers Quay, Butetown, Cardiff CF10 4NS
| Today | See what it's worth now |
| 20 Mar 2026 | £200,000 |
| 18 Jan 2019 | £183,000 |
3, Roma House, Vellacott Close, Butetown, Cardiff CF10 4AQ
| Today | See what it's worth now |
| 20 Mar 2026 | £158,000 |
| 10 Jun 2022 | £144,000 |
31, Amity Court, Longueil Close, Butetown, Cardiff CF10 4EA
| Today | See what it's worth now |
| 18 Mar 2026 | £200,000 |
| 13 Jul 2001 | £112,000 |
No other historical records.
27, The Granary, Magretian Place, Butetown, Cardiff CF10 4BR
| Today | See what it's worth now |
| 27 Feb 2026 | £135,000 |
| 6 Dec 2019 | £122,500 |
75, Aprilia House, Ffordd Garthorne, Butetown, Cardiff CF10 4DL
| Today | See what it's worth now |
| 25 Feb 2026 | £105,000 |
| 27 Jun 2003 | £108,000 |
66, Corvette Court, Butetown, Cardiff CF10 4NN
| Today | See what it's worth now |
| 23 Feb 2026 | £217,000 |
| 21 Oct 2022 | £190,000 |
24, Henke Court, Butetown, Cardiff CF10 4EB

| Today | See what it's worth now |
| 13 Feb 2026 | £250,000 |
| 21 Nov 2022 | £262,000 |
80, Aprilia House, Ffordd Garthorne, Butetown, Cardiff CF10 4DL
| Today | See what it's worth now |
| 11 Feb 2026 | £209,950 |
| 22 Sep 2006 | £169,000 |
6, Barletta House, Vellacott Close, Butetown, Cardiff CF10 4AF
| Today | See what it's worth now |
| 5 Feb 2026 | £185,000 |
| 4 Sep 2023 | £190,000 |
8, Kirkby Court, Craiglee Drive, Butetown, Cardiff CF10 4BS
| Today | See what it's worth now |
| 30 Jan 2026 | £230,000 |
| 14 Jul 2017 | £135,000 |
No other historical records.
19, Henke Court, Butetown, Cardiff CF10 4EB
| Today | See what it's worth now |
| 29 Jan 2026 | £224,999 |
| 5 Jun 2001 | £160,000 |
No other historical records.
7, Minori House, Ffordd Garthorne, Butetown, Cardiff CF10 4DB
| Today | See what it's worth now |
| 23 Jan 2026 | £195,000 |
| 23 Oct 2020 | £162,500 |
136, Henke Court, Butetown, Cardiff CF10 4EJ
| Today | See what it's worth now |
| 23 Jan 2026 | £209,000 |
| 6 Mar 2020 | £185,000 |
9, Jellicoe Court, Atlantic Wharf, Butetown, Cardiff CF10 4AJ
| Today | See what it's worth now |
| 16 Jan 2026 | £175,000 |
| 19 May 2017 | £167,500 |
19, Llansannor Drive, Butetown, Cardiff CF10 4BW
| Today | See what it's worth now |
| 16 Jan 2026 | £185,000 |
No other historical records.
39, Rimini House, Ffordd Garthorne, Butetown, Cardiff CF10 4DH
| Today | See what it's worth now |
| 16 Jan 2026 | £132,500 |
| 19 Jun 2001 | £81,000 |
No other historical records.
8, Schooner Way, Butetown, Cardiff CF10 4EQ
| Today | See what it's worth now |
| 14 Jan 2026 | £175,000 |
| 13 Dec 2019 | £154,000 |
No other historical records.
61, Corvette Court, Butetown, Cardiff CF10 4NN

| Today | See what it's worth now |
| 19 Dec 2025 | £130,000 |
| 12 Mar 2009 | £110,000 |
18, Craiglee Drive, Butetown, Cardiff CF10 4BN

| Today | See what it's worth now |
| 19 Dec 2025 | £250,000 |
| 13 Oct 2000 | £67,500 |
13, Moorby Court, Craiglee Drive, Butetown, Cardiff CF10 4BT

| Today | See what it's worth now |
| 19 Dec 2025 | £212,000 |
No other historical records.

Source Acknowledgement: © Crown copyright. England and Wales house price data is publicly available information produced by the HM Land Registry.This material was last updated on 9 July 2026. It covers the period from 1 January 1995 to 30 April 2026 and contains property transactions which have been registered during that period. Contains HM Land Registry data © Crown copyright and database right 2026. This data is licensed under the Open Government Licence v3.0.
Disclaimer: Rightmove.co.uk provides this HM Land Registry data "as is". The burden for fitness of the data relies completely with the user and is provided for informational purposes only. No warranty, express or implied, is given relating to the accuracy of content of the HM Land Registry data and Rightmove does not accept any liability for error or omission. If you have found an error with the data or need further information please contact HM Land Registry.
Permitted Use: Viewers of this Information are granted permission to access this Crown copyright material and to download it onto electronic, magnetic, optical or similar storage media provided that such activities are for private research, study or in-house use only. Any other use of the material requires the formal written permission of Land Registry which can be requested from us, and is subject to an additional licence and associated charge.
Rightmove takes no liability for your use of, or reliance on, Rightmove's Instant Valuation due to the limitations of our tracking tool listed here. Use of this tool is taken entirely at your own risk. All rights reserved.