
House Prices in The Folly
House prices in The Folly have an overall average of £295,847 over the last year.
The majority of properties sold in The Folly during the last year were flats, selling for an average price of £224,817. Terraced properties sold for an average of £350,823, with semi-detached properties fetching £397,526.
Overall, the historical sold prices in The Folly over the last year were 7% up on the previous year and similar to the 2017 peak of £295,271.
Properties Sold
3, Jubilee Road, Newbury RG14 7NN
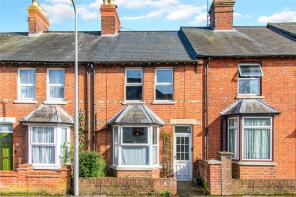
| Today | See today's value |
| 14 Aug 2026 | £320,000 |
| 6 Oct 2017 | £275,000 |
13, Railway Road, Newbury RG14 7PE
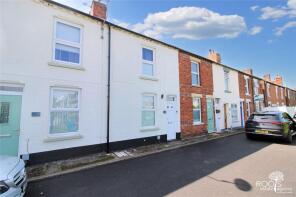
| Today | See today's value |
| 13 Aug 2026 | £270,000 |
| 20 Apr 2018 | £235,000 |
12, Lincoln Court, Craven Road, Newbury RG14 5NZ
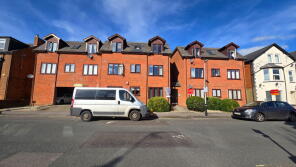
| Today | See today's value |
| 7 Aug 2026 | £148,000 |
| 9 Nov 2015 | £148,000 |
No other historical records.
Flat 4, 38, Craven Road, Newbury RG14 5NJ
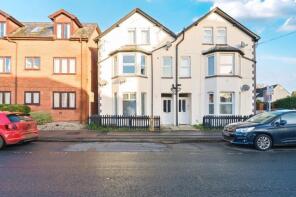
| Today | See today's value |
| 31 Jul 2026 | £155,000 |
| 12 Oct 2020 | £149,000 |
33, Selkirk House, Kingman Way, Newbury RG14 7GP

| Today | See today's value |
| 31 Jul 2026 | £108,000 |
| 14 Apr 2022 | £106,000 |
19, Railway Road, Newbury RG14 7PE
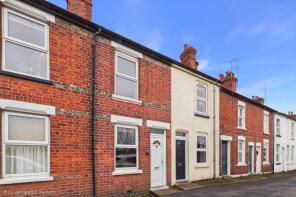
| Today | See today's value |
| 31 Jul 2026 | £258,000 |
| 13 Sep 2018 | £218,000 |
16, Home Straight, Newbury RG14 7XA
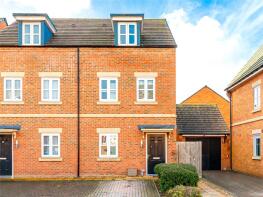
| Today | See today's value |
| 22 Jul 2026 | £440,000 |
| 26 Aug 2022 | £162,000 |
No other historical records.
2, Atlantean Court, Thornycroft Close, Newbury RG14 5QG
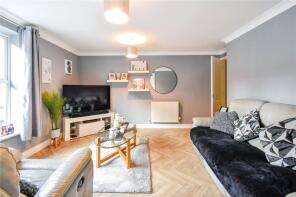
| Today | See today's value |
| 17 Jul 2026 | £218,500 |
| 16 Aug 2022 | £230,000 |
3, Church Mews, Oddfellows Road, Newbury RG14 5PL
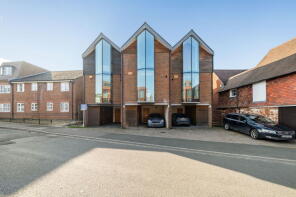
| Today | See today's value |
| 15 Jul 2026 | £430,000 |
| 18 Jan 2016 | £300,000 |
27, Cape Cross House, Kingman Way, Newbury RG14 7GU
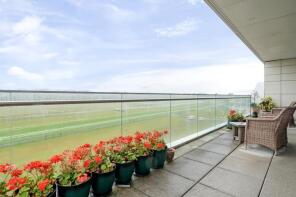
| Today | See today's value |
| 15 Jul 2026 | £495,000 |
| 30 Apr 2018 | £599,000 |
No other historical records.
12, Blenheim Road, Newbury RG14 5JH

| Today | See today's value |
| 10 Jul 2026 | £495,000 |
| 31 Mar 2017 | £410,000 |
110, Gloucester Road, Newbury RG14 5JJ

| Today | See today's value |
| 10 Jul 2026 | £532,500 |
| 20 Jun 2014 | £344,000 |
31, Braunfels Walk, Newbury RG14 5NQ
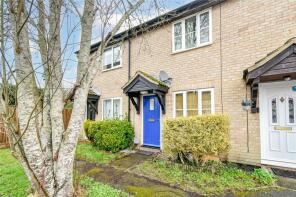
| Today | See today's value |
| 3 Jul 2026 | £205,000 |
| 14 Jul 2008 | £149,000 |
53, Southmead House, Kingman Way, Newbury RG14 7FY
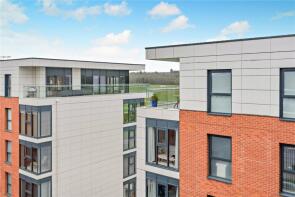
| Today | See today's value |
| 30 Jun 2026 | £215,000 |
| 31 Mar 2017 | £217,000 |
No other historical records.
51, Lockinge House, Kingman Way, Newbury RG14 7GR
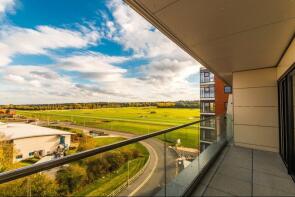
| Today | See today's value |
| 26 Jun 2026 | £222,500 |
| 21 Dec 2018 | £242,000 |
No other historical records.
11, Stanley Road, Newbury RG14 7PB
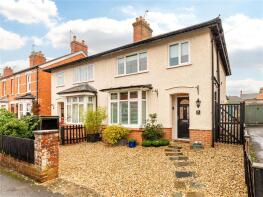
| Today | See today's value |
| 25 Jun 2026 | £470,500 |
| 25 Feb 2022 | £452,250 |
9, St Michaels Road, Newbury RG14 5PT

| Today | See today's value |
| 19 Jun 2026 | £407,500 |
| 9 Dec 2010 | £211,700 |
No other historical records.
12, Alexander Court, Thornycroft Close, Newbury RG14 5QG
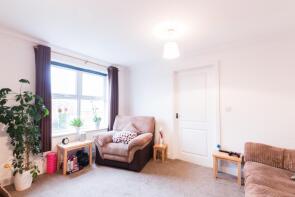
| Today | See today's value |
| 16 Jun 2026 | £208,000 |
| 31 Jul 2007 | £189,960 |
28, Green Lane, Newbury RG14 5NU

| Today | See today's value |
| 12 Jun 2026 | £365,000 |
| 3 Apr 2020 | £268,000 |
140, Russell Road, Newbury RG14 5JU

| Today | See today's value |
| 5 Jun 2026 | £500,000 |
| 28 Mar 2017 | £319,950 |
No other historical records.
6, Green Lane, Newbury RG14 5NU

| Today | See today's value |
| 5 Jun 2026 | £326,250 |
| 21 May 2008 | £157,000 |
8, Lockinge House, Kingman Way, Newbury RG14 7GR
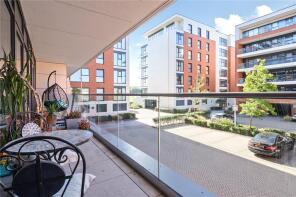
| Today | See today's value |
| 5 Jun 2026 | £244,000 |
| 7 Jun 2019 | £249,000 |
No other historical records.
5, Denmark Road, Newbury RG14 5SR

| Today | See today's value |
| 14 May 2026 | £322,300 |
| 28 Feb 2020 | £265,000 |


Rightmove takes no liability for your use of, or reliance on, Rightmove's Instant Valuation due to the limitations of our tracking tool listed here. Use of this tool is taken entirely at your own risk. All rights reserved.