
House Prices in The Folly
House prices in The Folly have an overall average of £306,540 over the last year.
The majority of properties sold in The Folly during the last year were terraced properties, selling for an average price of £255,708. Semi-detached properties sold for an average of £302,392, with detached properties fetching £439,810.
Overall, the historical sold prices in The Folly over the last year were 5% up on the previous year and 4% down on the 2022 peak of £317,914.
Properties Sold
6, Lingfield Close, Chippenham SN14 0XN

| Today | See today's value |
| 25 Aug 2026 | £250,000 |
| 13 Sep 2004 | £130,000 |
No other historical records.
37, Woodlands Road, Chippenham SN14 0HG
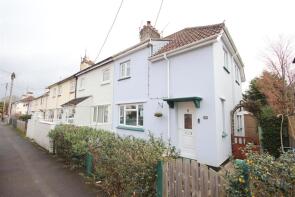
| Today | See today's value |
| 17 Aug 2026 | £245,000 |
| 28 Feb 2020 | £176,500 |
No other historical records.
68, Andrews Close, Chippenham SN14 0TX
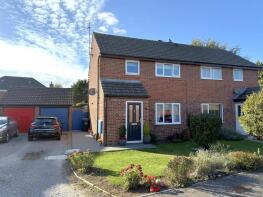
| Today | See today's value |
| 13 Aug 2026 | £300,000 |
| 17 Sep 2020 | £223,000 |
No other historical records.
27, Allington Way, Chippenham SN14 0JT
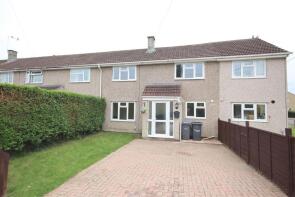
| Today | See today's value |
| 11 Aug 2026 | £276,500 |
| 22 May 2008 | £173,000 |
5, Aintree Drive, Chippenham SN14 0FA
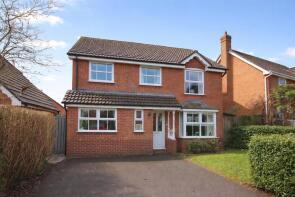
| Today | See today's value |
| 7 Aug 2026 | £470,000 |
| 25 Sep 2020 | £376,950 |
3, Culverwell Road, Chippenham SN14 0TA
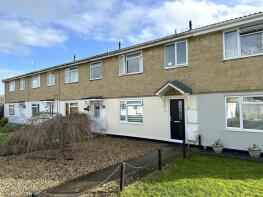
| Today | See today's value |
| 31 Jul 2026 | £262,500 |
| 4 Mar 2016 | £180,200 |
23, Huntingdon Way, Chippenham SN14 0XY
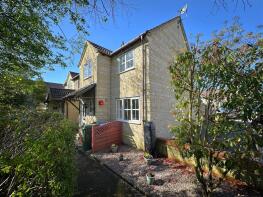
| Today | See today's value |
| 22 Jul 2026 | £265,000 |
| 16 Sep 2021 | £260,000 |
4, Kingham Close, Chippenham SN14 0PB
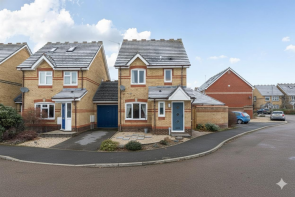
| Today | See today's value |
| 21 Jul 2026 | £352,000 |
| 17 Jun 2020 | £270,000 |
10, Haydock Close, Chippenham SN14 0YE

| Today | See today's value |
| 17 Jul 2026 | £245,000 |
| 1 Aug 2005 | £137,000 |
2, Weavern Court, Chippenham SN14 0LU

| Today | See today's value |
| 17 Jul 2026 | £167,000 |
| 11 Jul 2016 | £138,500 |
39, Stonelea Close, Chippenham SN14 0DD

| Today | See today's value |
| 17 Jul 2026 | £280,000 |
| 25 Feb 1998 | £56,601 |
No other historical records.
9, Thirsk Close, Chippenham SN14 0SJ
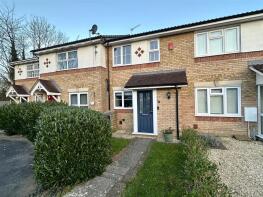
| Today | See today's value |
| 13 Jul 2026 | £255,000 |
| 16 Oct 2020 | £210,000 |
31, Derriads Green, Chippenham SN14 0QR

| Today | See today's value |
| 2 Jul 2026 | £250,000 |
| 21 Sep 2001 | £89,950 |
No other historical records.
110, Ladyfield Road, Chippenham SN14 0AW

| Today | See today's value |
| 26 Jun 2026 | £292,500 |
| 13 Jul 2020 | £212,000 |
7, Culverwell Road, Chippenham SN14 0TA
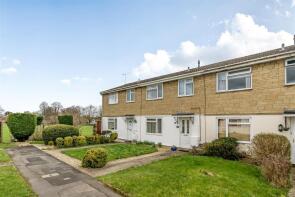
| Today | See today's value |
| 26 Jun 2026 | £285,000 |
| 16 Jul 2021 | £245,000 |
No other historical records.
59, Chamberlain Road, Chippenham SN14 0TF

| Today | See today's value |
| 26 Jun 2026 | £535,000 |
| 17 Jan 2013 | £219,000 |
9, Chestnut Road, Chippenham SN14 0EY
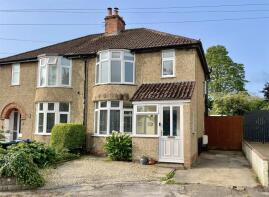
| Today | See today's value |
| 25 Jun 2026 | £368,000 |
| 18 Nov 2020 | £301,500 |
30, Avebury Road, Chippenham SN14 0NX
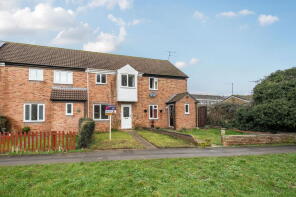
| Today | See today's value |
| 22 Jun 2026 | £230,000 |
No other historical records.
24, Cranwell Close, Chippenham SN14 0QG
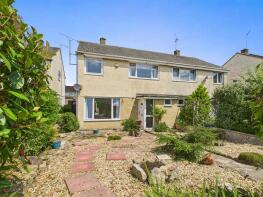
| Today | See today's value |
| 19 Jun 2026 | £320,000 |
No other historical records.
39, Plantation Road, Chippenham SN14 0EX
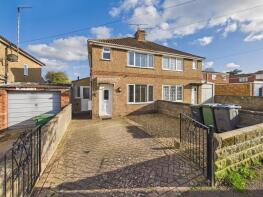
| Today | See today's value |
| 12 Jun 2026 | £300,000 |
| 1 Oct 2010 | £145,000 |
No other historical records.
9, Catterick Close, Chippenham SN14 0YP

| Today | See today's value |
| 10 Jun 2026 | £247,500 |
| 2 Oct 2017 | £232,500 |
23, Sarum Road, Chippenham SN14 0QA

| Today | See today's value |
| 10 Jun 2026 | £315,000 |
| 1 Aug 2005 | £175,000 |
19, Minster Way, Chippenham SN14 0PY

| Today | See today's value |
| 10 Jun 2026 | £499,950 |
| 29 Jun 2017 | £270,000 |
No other historical records.
Rightmove takes no liability for your use of, or reliance on, Rightmove's Instant Valuation due to the limitations of our tracking tool listed here. Use of this tool is taken entirely at your own risk. All rights reserved.