
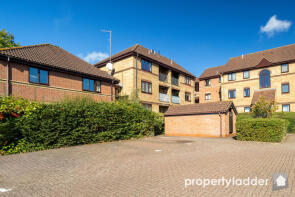
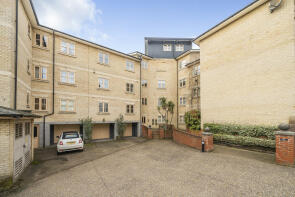
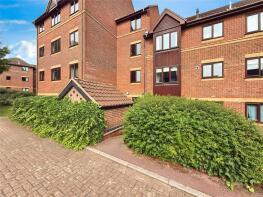
House Prices in Thorpe
House prices in Thorpe have an overall average of £177,648 over the last year.
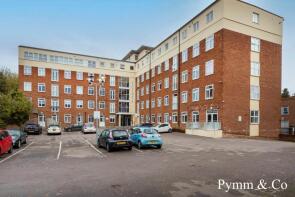
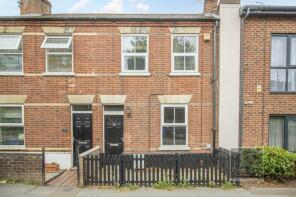
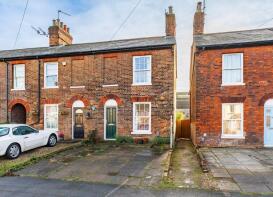
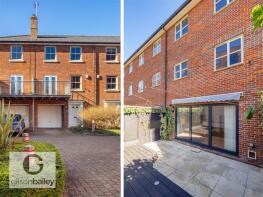
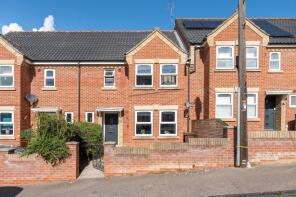
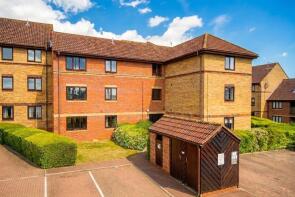
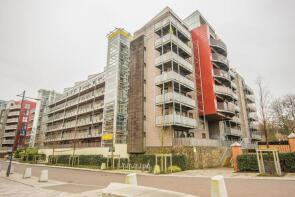
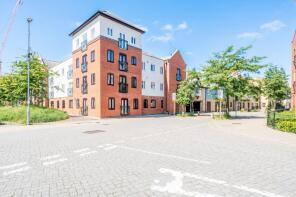
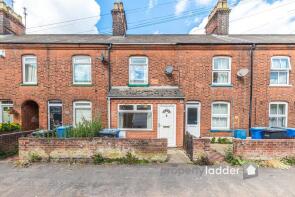
The majority of properties sold in Thorpe during the last year were flats, selling for an average price of £143,303. Terraced properties sold for an average of £300,372, with semi-detached properties fetching £241,167.
Overall, the historical sold prices in Thorpe over the last year were 15% down on the previous year and 15% down on the 2020 peak of £210,186.
Properties Sold
32, Wilson Road, Norwich NR1 1YP

| Today | See what it's worth now |
| 27 Apr 2026 | £150,000 |
| 8 Jan 2021 | £147,500 |
32, Scott Road, Norwich NR1 1YR
| Today | See what it's worth now |
| 24 Apr 2026 | £158,000 |
| 14 Nov 2003 | £106,000 |
39, 122 Eastgate House, Thorpe Road, Norwich NR1 1FE
| Today | See what it's worth now |
| 15 Apr 2026 | £155,000 |
| 22 Jun 2018 | £150,000 |
No other historical records.
18, Morgan House, Rouen Road, Norwich NR1 1QQ

| Today | See what it's worth now |
| 10 Apr 2026 | £149,000 |
| 24 Jan 2005 | £157,000 |
No other historical records.
68, Rosary Road, Norwich NR1 1TQ
| Today | See what it's worth now |
| 8 Apr 2026 | £238,000 |
| 6 Nov 2020 | £220,000 |
17, Kerrison Road, Norwich NR1 1JB
| Today | See what it's worth now |
| 30 Mar 2026 | £259,000 |
| 27 Jan 2022 | £209,000 |
No other historical records.
9, Baltic Wharf, Norwich NR1 1QA
| Today | See what it's worth now |
| 20 Mar 2026 | £442,500 |
| 2 Feb 2007 | £285,000 |
No other historical records.
3, Aspland Road, Norwich NR1 1SH
| Today | See what it's worth now |
| 20 Mar 2026 | £370,000 |
| 26 Mar 2021 | £307,000 |
48, Scott Road, Norwich NR1 1YR
| Today | See what it's worth now |
| 16 Mar 2026 | £90,000 |
| 24 Mar 1995 | £38,500 |
No other historical records.
9, Ashman Bank, Geoffrey Watling Way, Norwich NR1 1HB
| Today | See what it's worth now |
| 10 Mar 2026 | £208,000 |
| 6 Jul 2007 | £212,500 |
No other historical records.
Apartment 12, Regency Court, Lower Clarence Road, Norwich NR1 1ER
| Today | See what it's worth now |
| 6 Mar 2026 | £330,000 |
| 5 Jan 2005 | £247,950 |
No other historical records.
49, Hardy Road, Norwich NR1 1JN
| Today | See what it's worth now |
| 6 Mar 2026 | £130,000 |
| 16 Jun 2023 | £125,000 |
No other historical records.
10, Worster Court, Ranson Road, Norwich NR1 4AW
| Today | See what it's worth now |
| 27 Feb 2026 | £146,000 |
| 31 Jan 2008 | £156,000 |
No other historical records.
59, Cozens Road, Norwich NR1 1JJ

| Today | See what it's worth now |
| 27 Feb 2026 | £247,500 |
| 24 Jul 2020 | £172,500 |
3, Ashman Bank, Geoffrey Watling Way, Norwich NR1 1HB
| Today | See what it's worth now |
| 25 Feb 2026 | £125,000 |
| 4 Sep 2006 | £131,816 |
No other historical records.
128a, King Street, Norwich NR1 1QE
| Today | See what it's worth now |
| 6 Feb 2026 | £255,000 |
| 15 May 2021 | £196,000 |
18, Sidestrand, Wherry Road, Norwich NR1 1TB
| Today | See what it's worth now |
| 6 Feb 2026 | £170,000 |
| 19 Mar 2004 | £155,000 |
No other historical records.
9, Hardy Road, Norwich NR1 1JL
| Today | See what it's worth now |
| 5 Feb 2026 | £210,000 |
| 22 Oct 1999 | £44,000 |
65, Scott Road, Norwich NR1 1YL
| Today | See what it's worth now |
| 5 Feb 2026 | £158,000 |
| 19 Feb 2018 | £150,000 |
83, Maidstone Road, Norwich NR1 1EA
| Today | See what it's worth now |
| 30 Jan 2026 | £150,000 |
| 9 May 2014 | £61,000 |
No other historical records.
93, Glendenning Road, Norwich NR1 1YN
| Today | See what it's worth now |
| 23 Jan 2026 | £155,000 |
| 12 Nov 2004 | £118,500 |
12, Allison Bank, Geoffrey Watling Way, Norwich NR1 1GW
| Today | See what it's worth now |
| 23 Jan 2026 | £95,500 |
| 18 Sep 2009 | £83,000 |
No other historical records.
2, 4 Riverway Court, Recorder Road, Norwich NR1 1BP

| Today | See what it's worth now |
| 13 Jan 2026 | £100,000 |
| 23 Apr 2018 | £137,500 |
Source Acknowledgement: © Crown copyright. England and Wales house price data is publicly available information produced by the HM Land Registry.This material was last updated on 9 July 2026. It covers the period from 1 January 1995 to 30 April 2026 and contains property transactions which have been registered during that period. Contains HM Land Registry data © Crown copyright and database right 2026. This data is licensed under the Open Government Licence v3.0.
Disclaimer: Rightmove.co.uk provides this HM Land Registry data "as is". The burden for fitness of the data relies completely with the user and is provided for informational purposes only. No warranty, express or implied, is given relating to the accuracy of content of the HM Land Registry data and Rightmove does not accept any liability for error or omission. If you have found an error with the data or need further information please contact HM Land Registry.
Permitted Use: Viewers of this Information are granted permission to access this Crown copyright material and to download it onto electronic, magnetic, optical or similar storage media provided that such activities are for private research, study or in-house use only. Any other use of the material requires the formal written permission of Land Registry which can be requested from us, and is subject to an additional licence and associated charge.
Rightmove takes no liability for your use of, or reliance on, Rightmove's Instant Valuation due to the limitations of our tracking tool listed here. Use of this tool is taken entirely at your own risk. All rights reserved.