
House Prices in Three Score
House prices in Three Score have an overall average of £249,930 over the last year.
The majority of properties sold in Three Score during the last year were detached properties, selling for an average price of £303,344. Semi-detached properties sold for an average of £223,346, with terraced properties fetching £222,027.
Overall, the historical sold prices in Three Score over the last year were 2% up on the previous year and 3% up on the 2023 peak of £243,117.
Properties Sold
16, Walcot Close, Norwich NR5 9AJ
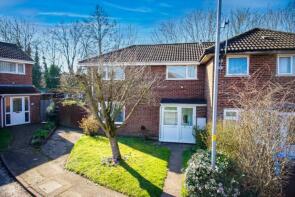
| Today | See today's value |
| 14 Aug 2026 | £215,000 |
| 5 Jan 2001 | £51,000 |
8, Layer Close, Norwich NR5 9NS
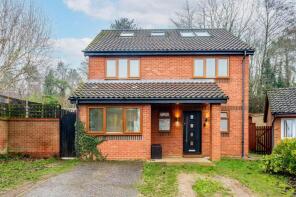
| Today | See today's value |
| 22 Jul 2026 | £380,000 |
| 11 Oct 2018 | £300,000 |
17, The Hedgerows, Norwich NR5 9BP
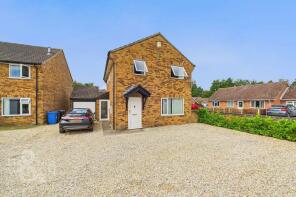
| Today | See today's value |
| 17 Jul 2026 | £307,000 |
| 16 Jun 2003 | £150,000 |
No other historical records.
31, Lushington Close, Norwich NR5 9AU
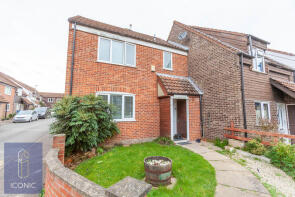
| Today | See today's value |
| 2 Jul 2026 | £215,000 |
| 8 Aug 2006 | £134,950 |
No other historical records.
14, Purdance Close, Norwich NR5 9PA

| Today | See today's value |
| 29 Jun 2026 | £187,500 |
| 12 May 2005 | £122,000 |
No other historical records.
24, Atkinson Close, Norwich NR5 9NE
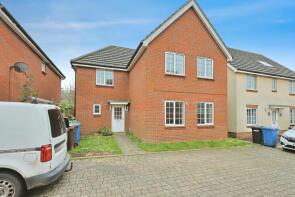
| Today | See today's value |
| 12 Jun 2026 | £300,000 |
| 12 Jul 2013 | £200,000 |
8, Mawkin Close, Norwich NR5 9PT
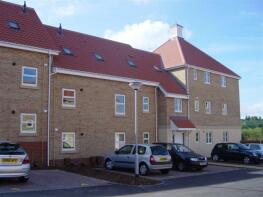
| Today | See today's value |
| 10 Jun 2026 | £149,000 |
| 19 Aug 2005 | £110,950 |
No other historical records.
5, Fitzhenry Mews, Norwich NR5 9BH

| Today | See today's value |
| 5 Jun 2026 | £277,000 |
| 21 Mar 2019 | £213,000 |
12, Horn-pie Road, Norwich NR5 9PW
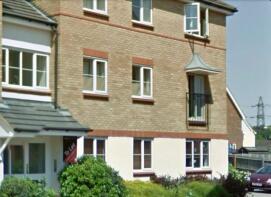
| Today | See today's value |
| 29 May 2026 | £145,000 |
| 26 Aug 2005 | £124,950 |
No other historical records.
14, The Hedgerows, Norwich NR5 9BP
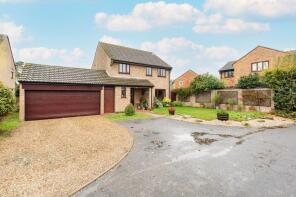
| Today | See today's value |
| 29 May 2026 | £360,000 |
| 15 Feb 2017 | £265,000 |
No other historical records.
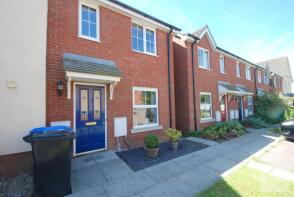
27, Fresher Mews, Norwich NR5 9HF
| Today | See today's value |
| 12 May 2026 | £207,500 |
| 7 Feb 2006 | £129,950 |
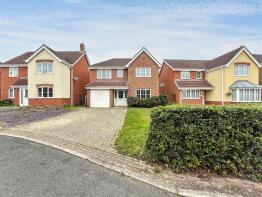
36, Speedwell Way, Norwich NR5 9HP
| Today | See today's value |
| 1 Apr 2026 | £338,000 |
| 28 Aug 2014 | £217,000 |
28, Notykin Street, Norwich NR5 9DN

| Today | See today's value |
| 20 Mar 2026 | £230,216 |
| 22 Jan 2021 | £182,000 |
16, The Hedgerows, Norwich NR5 9BP

| Today | See today's value |
| 11 Mar 2026 | £320,000 |
| 23 Jun 2014 | £220,000 |
22, Lushington Close, Norwich NR5 9AU

| Today | See today's value |
| 6 Mar 2026 | £250,000 |
| 8 Apr 2004 | £108,000 |
60, Holworthy Road, Norwich NR5 9DG

| Today | See today's value |
| 3 Mar 2026 | £200,000 |
| 23 Oct 2017 | £175,000 |
47, Caddow Road, Norwich NR5 9PQ

| Today | See today's value |
| 13 Feb 2026 | £252,000 |
| 15 Dec 2016 | £215,000 |
4, Walcot Close, Norwich NR5 9AJ

| Today | See today's value |
| 13 Feb 2026 | £267,000 |
| 1 Apr 2003 | £136,000 |
No other historical records.
71, Stylman Road, Norwich NR5 9ET

| Today | See today's value |
| 6 Feb 2026 | £208,000 |
| 16 Nov 2018 | £165,000 |
9, Webster Close, Norwich NR5 9DF

| Today | See today's value |
| 30 Jan 2026 | £227,500 |
No other historical records.
5, Bateman Close, Harpsfield, Norwich NR5 9LE
| Today | See today's value |
| 30 Jan 2026 | £202,500 |
| 20 Oct 2006 | £127,500 |
No other historical records.
79, Swafield Street, Norwich NR5 9EA

| Today | See today's value |
| 16 Jan 2026 | £200,000 |
| 19 Oct 2017 | £182,000 |
22, Thurston Close, Norwich NR5 9LS

| Today | See today's value |
| 22 Dec 2025 | £212,000 |
| 21 May 2019 | £180,000 |


Rightmove takes no liability for your use of, or reliance on, Rightmove's Instant Valuation due to the limitations of our tracking tool listed here. Use of this tool is taken entirely at your own risk. All rights reserved.