
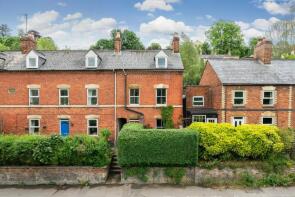
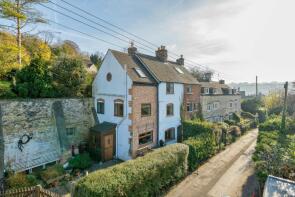
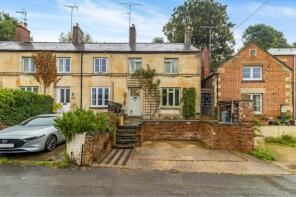
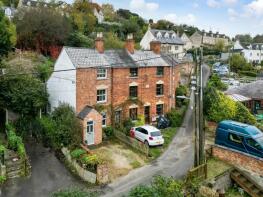
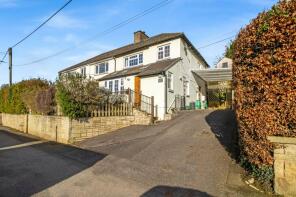
House Prices in Thrupp
House prices in Thrupp have an overall average of £405,515 over the last year.
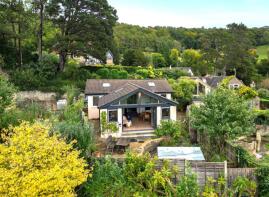
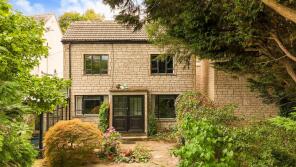
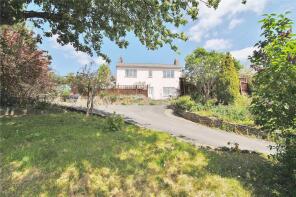
The majority of properties sold in Thrupp during the last year were detached properties, selling for an average price of £455,412. Semi-detached properties sold for an average of £377,625, with terraced properties fetching £361,500.
Overall, the historical sold prices in Thrupp over the last year were 6% down on the previous year and 3% down on the 2022 peak of £415,938.
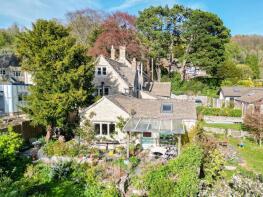
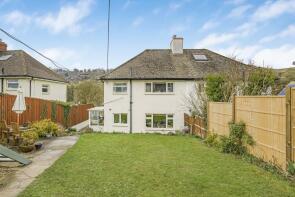
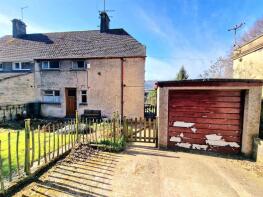
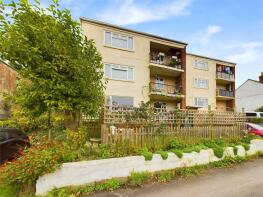
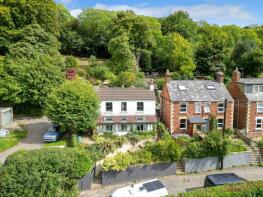
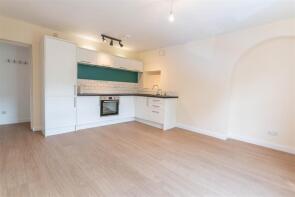
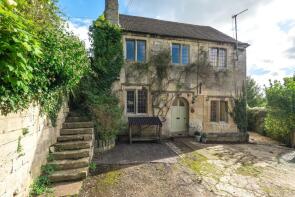
Properties Sold
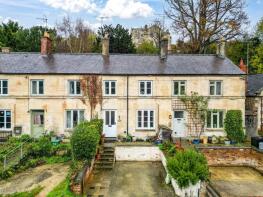
4, Glyn Terrace, Middle Road, Thrupp, Stroud GL5 2DN
| Today | See what it's worth now |
| 5 Feb 2026 | £365,500 |
| 19 Jul 2018 | £245,000 |
142a, Thrupp Lane, Thrupp, Stroud GL5 2EQ
| Today | See what it's worth now |
| 27 Jan 2026 | £435,000 |
| 31 Mar 2021 | £345,000 |
Ivy Villa, Spring Lane, Thrupp, Stroud GL5 2DT
| Today | See what it's worth now |
| 5 Jan 2026 | £246,650 |
No other historical records.
Glenhurst, Middle Road, Thrupp, Stroud GL5 2DR
| Today | See what it's worth now |
| 15 Dec 2025 | £360,000 |
| 23 Nov 2023 | £333,000 |
No other historical records.
4, Albion Terrace, London Road, Thrupp, Stroud GL5 2BD
| Today | See what it's worth now |
| 12 Dec 2025 | £357,500 |
| 11 Oct 2002 | £147,500 |
1, Dallaway Estate, Thrupp, Stroud GL5 2EB

| Today | See what it's worth now |
| 12 Dec 2025 | £357,500 |
| 28 Jun 2019 | £182,000 |
No other historical records.
94a, Thrupp Lane, Thrupp, Stroud GL5 2DQ
| Today | See what it's worth now |
| 10 Dec 2025 | £380,000 |
No other historical records.
144, Thrupp Lane, Thrupp, Stroud GL5 2EQ
| Today | See what it's worth now |
| 10 Dec 2025 | £385,000 |
| 2 Dec 2016 | £250,000 |
Maeville, High Orchard, London Road, Thrupp, Stroud GL5 2ES
| Today | See what it's worth now |
| 25 Sep 2025 | £358,000 |
| 20 Mar 2020 | £265,000 |
The Coach House, 50, Thrupp Lane, Thrupp, Stroud GL5 2ER

| Today | See what it's worth now |
| 3 Sep 2025 | £810,000 |
No other historical records.
1, Brimscombe Court Drive, Thrupp Lane, Thrupp, Stroud GL5 2ED
| Today | See what it's worth now |
| 12 Jun 2025 | £280,000 |
No other historical records.
139, Thrupp Lane, Thrupp, Stroud GL5 2DQ
| Today | See what it's worth now |
| 30 May 2025 | £385,000 |
| 13 May 2015 | £240,000 |
5, Glyn Terrace, Middle Road, Thrupp, Stroud GL5 2DN
| Today | See what it's worth now |
| 21 May 2025 | £310,000 |
| 11 Mar 2020 | £273,000 |
1, Jubilee Crescent, Middle Road, Thrupp, Stroud GL5 2DP
| Today | See what it's worth now |
| 31 Mar 2025 | £319,000 |
| 26 Oct 2015 | £187,000 |
16, Great Orchard, London Road, Thrupp, Stroud GL5 2DJ
| Today | See what it's worth now |
| 28 Mar 2025 | £385,000 |
No other historical records.
1, Greenhill Flats, Middle Road, Thrupp, Stroud GL5 2DW
| Today | See what it's worth now |
| 18 Mar 2025 | £170,000 |
| 4 Dec 2019 | £150,000 |
Palomares, London Road, Thrupp, Stroud GL5 2BL

| Today | See what it's worth now |
| 18 Oct 2024 | £395,000 |
| 22 Dec 2020 | £330,000 |
No other historical records.
Ivy Cottage, Spring Lane, Thrupp, Stroud GL5 2DT

| Today | See what it's worth now |
| 18 Oct 2024 | £300,000 |
| 28 Jun 2004 | £137,500 |
No other historical records.
4, Yew Tree Way, Thrupp, Stroud GL5 2EL

| Today | See what it's worth now |
| 12 Sep 2024 | £310,000 |
No other historical records.
68, Thrupp Lane, Thrupp, Stroud GL5 2DG

| Today | See what it's worth now |
| 6 Aug 2024 | £950,000 |
| 29 Jul 2022 | £390,000 |
34, Dallaway Estate, Thrupp, Stroud GL5 2EB

| Today | See what it's worth now |
| 2 Aug 2024 | £285,000 |
No other historical records.
123, Thrupp Lane, Thrupp, Stroud GL5 2DQ
| Today | See what it's worth now |
| 29 Jul 2024 | £825,000 |
| 11 Aug 2015 | £518,000 |
No other historical records.
2, Meadow View, London Road, Thrupp, Stroud GL5 2BL
| Today | See what it's worth now |
| 24 Jul 2024 | £118,500 |
| 18 May 2018 | £74,500 |
No other historical records.
Source Acknowledgement: © Crown copyright. England and Wales house price data is publicly available information produced by the HM Land Registry.This material was last updated on 9 July 2026. It covers the period from 1 January 1995 to 30 April 2026 and contains property transactions which have been registered during that period. Contains HM Land Registry data © Crown copyright and database right 2026. This data is licensed under the Open Government Licence v3.0.
Disclaimer: Rightmove.co.uk provides this HM Land Registry data "as is". The burden for fitness of the data relies completely with the user and is provided for informational purposes only. No warranty, express or implied, is given relating to the accuracy of content of the HM Land Registry data and Rightmove does not accept any liability for error or omission. If you have found an error with the data or need further information please contact HM Land Registry.
Permitted Use: Viewers of this Information are granted permission to access this Crown copyright material and to download it onto electronic, magnetic, optical or similar storage media provided that such activities are for private research, study or in-house use only. Any other use of the material requires the formal written permission of Land Registry which can be requested from us, and is subject to an additional licence and associated charge.
Rightmove takes no liability for your use of, or reliance on, Rightmove's Instant Valuation due to the limitations of our tracking tool listed here. Use of this tool is taken entirely at your own risk. All rights reserved.