
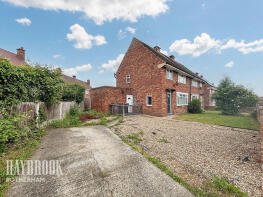
House Prices in Thurcroft
House prices in Thurcroft have an overall average of £184,113 over the last year.
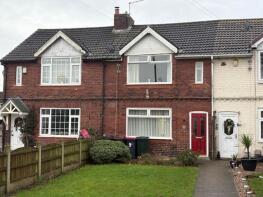
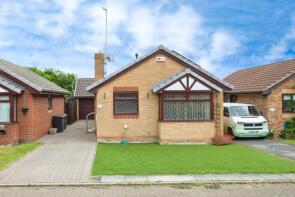
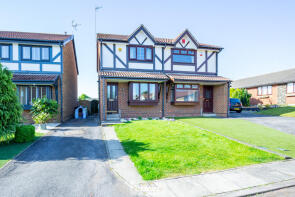
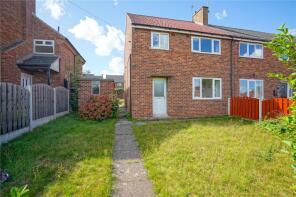
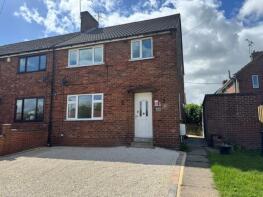
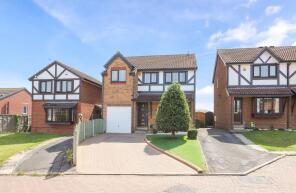
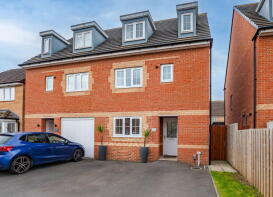
The majority of properties sold in Thurcroft during the last year were semi-detached properties, selling for an average price of £165,224. Detached properties sold for an average of £265,500, with terraced properties fetching £133,000.
Overall, the historical sold prices in Thurcroft over the last year were 4% up on the previous year and 5% up on the 2022 peak of £175,347.
Properties Sold
11, Clarke Avenue, Thurcroft, Rotherham S66 9DP
| Today | See what it's worth now |
| 17 Apr 2026 | £280,000 |
| 23 Sep 2021 | £220,000 |
No other historical records.
21, Candle Crescent, Thurcroft, Rotherham S66 9FH
| Today | See what it's worth now |
| 17 Apr 2026 | £255,000 |
| 31 Mar 2017 | £194,950 |
No other historical records.
38, Charles Street, Thurcroft, Rotherham S66 9HQ
| Today | See what it's worth now |
| 10 Apr 2026 | £134,500 |
| 30 Jun 2023 | £127,500 |
43, Brampton Meadows, Thurcroft, Rotherham S66 9ND
| Today | See what it's worth now |
| 2 Apr 2026 | £195,000 |
| 21 Dec 2001 | £68,500 |
No other historical records.
18, Sawn Moor Avenue, Thurcroft, Rotherham S66 9DQ

| Today | See what it's worth now |
| 27 Mar 2026 | £251,000 |
| 20 Dec 2017 | £102,500 |
No other historical records.
119, Green Arbour Road, Thurcroft, Rotherham S66 9EL
| Today | See what it's worth now |
| 27 Mar 2026 | £245,000 |
| 15 Nov 2011 | £90,000 |
No other historical records.
28, The Crescent, Thurcroft, Rotherham S66 9LR
| Today | See what it's worth now |
| 19 Mar 2026 | £220,000 |
| 27 Aug 2021 | £170,000 |
No other historical records.
39, The Crescent, Thurcroft, Rotherham S66 9LR

| Today | See what it's worth now |
| 16 Mar 2026 | £190,000 |
| 11 Oct 2016 | £108,500 |
24, The Crescent, Thurcroft, Rotherham S66 9LR
| Today | See what it's worth now |
| 10 Mar 2026 | £180,000 |
| 8 Feb 2013 | £102,000 |
15, John Street, Thurcroft, Rotherham S66 9HJ
| Today | See what it's worth now |
| 10 Mar 2026 | £115,000 |
| 5 Oct 2021 | £95,000 |
9, Gurth Drive, Thurcroft, Rotherham S66 9QJ

| Today | See what it's worth now |
| 6 Mar 2026 | £110,000 |
| 9 Jun 2021 | £77,000 |
No other historical records.
5, Katherine Road, Thurcroft, Rotherham S66 9HF
| Today | See what it's worth now |
| 24 Feb 2026 | £99,995 |
| 29 Aug 2001 | £17,000 |
No other historical records.
49, Ivanhoe Road, Thurcroft, Rotherham S66 9PY
| Today | See what it's worth now |
| 13 Feb 2026 | £125,000 |
| 16 Aug 2007 | £92,000 |
No other historical records.
47, Brampton Meadows, Thurcroft, Rotherham S66 9ND
| Today | See what it's worth now |
| 6 Feb 2026 | £188,000 |
| 30 Apr 1999 | £59,000 |
No other historical records.
1, Katherine Court, Thurcroft, Rotherham S66 9HL

| Today | See what it's worth now |
| 6 Feb 2026 | £60,000 |
| 17 Oct 2003 | £39,950 |
No other historical records.
Corner Vale, Steadfolds Lane, Thurcroft, Rotherham S66 9LT
| Today | See what it's worth now |
| 30 Jan 2026 | £267,500 |
| 23 Feb 2024 | £230,000 |
27, Brampton Meadows, Thurcroft, Rotherham S66 9ND
| Today | See what it's worth now |
| 26 Jan 2026 | £245,000 |
| 17 Feb 2022 | £230,000 |
32, Brampton Meadows, Thurcroft, Rotherham S66 9ND
| Today | See what it's worth now |
| 16 Jan 2026 | £163,500 |
| 11 Dec 2020 | £122,000 |
16, St Edmunds Avenue, Thurcroft, Rotherham S66 9QL
| Today | See what it's worth now |
| 5 Jan 2026 | £125,000 |
No other historical records.
10, St Edmunds Avenue, Thurcroft, Rotherham S66 9QL
| Today | See what it's worth now |
| 18 Dec 2025 | £118,000 |
| 17 Aug 2020 | £85,000 |
No other historical records.
5, Levett Drive, Thurcroft, Rotherham S66 9FF

| Today | See what it's worth now |
| 12 Dec 2025 | £147,500 |
| 20 May 2022 | £135,000 |
12, Ivanhoe Road, Thurcroft, Rotherham S66 9PX
| Today | See what it's worth now |
| 11 Dec 2025 | £153,000 |
No other historical records.
34, Brampton Meadows, Thurcroft, Rotherham S66 9ND
| Today | See what it's worth now |
| 10 Dec 2025 | £280,000 |
| 10 Jan 2019 | £190,000 |
No other historical records.
Source Acknowledgement: © Crown copyright. England and Wales house price data is publicly available information produced by the HM Land Registry.This material was last updated on 9 July 2026. It covers the period from 1 January 1995 to 30 April 2026 and contains property transactions which have been registered during that period. Contains HM Land Registry data © Crown copyright and database right 2026. This data is licensed under the Open Government Licence v3.0.
Disclaimer: Rightmove.co.uk provides this HM Land Registry data "as is". The burden for fitness of the data relies completely with the user and is provided for informational purposes only. No warranty, express or implied, is given relating to the accuracy of content of the HM Land Registry data and Rightmove does not accept any liability for error or omission. If you have found an error with the data or need further information please contact HM Land Registry.
Permitted Use: Viewers of this Information are granted permission to access this Crown copyright material and to download it onto electronic, magnetic, optical or similar storage media provided that such activities are for private research, study or in-house use only. Any other use of the material requires the formal written permission of Land Registry which can be requested from us, and is subject to an additional licence and associated charge.
Rightmove takes no liability for your use of, or reliance on, Rightmove's Instant Valuation due to the limitations of our tracking tool listed here. Use of this tool is taken entirely at your own risk. All rights reserved.