
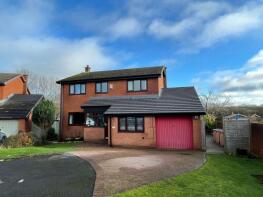
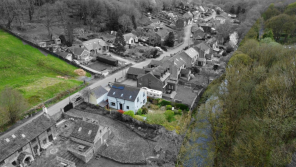
House Prices in Thurgoland
House prices in Thurgoland have an overall average of £370,227 over the last year.
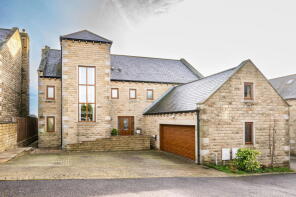
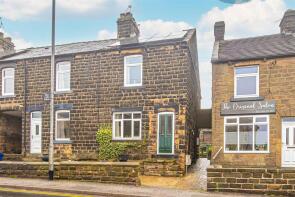
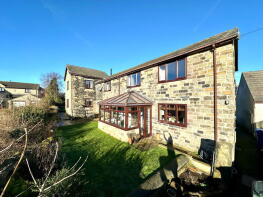
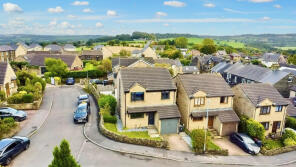
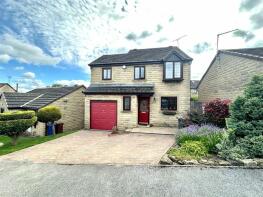
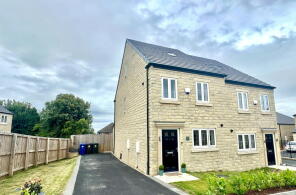
The majority of properties sold in Thurgoland during the last year were detached properties, selling for an average price of £520,000. Terraced properties sold for an average of £221,875, with semi-detached properties fetching £368,333.
Overall, the historical sold prices in Thurgoland over the last year were 3% up on the previous year and 3% down on the 2022 peak of £382,097.
Properties Sold
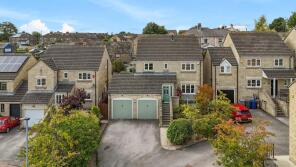
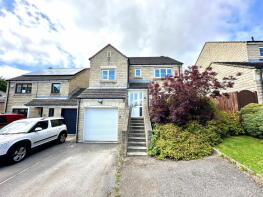
27, Hollin Moor View, Thurgoland, Sheffield S35 7EE
| Today | See what it's worth now |
| 27 Jan 2026 | £450,000 |
| 31 Aug 2010 | £250,000 |
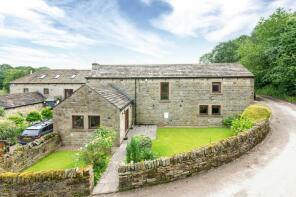
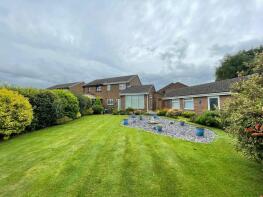
The Mistal, Huthwaite Lane, Thurgoland, Sheffield S35 7BU
| Today | See what it's worth now |
| 11 Dec 2025 | £520,000 |
| 18 May 2005 | £390,000 |
No other historical records.
21, Rookery Way, Thurgoland, Barnsley S35 7BX
| Today | See what it's worth now |
| 12 Nov 2025 | £370,000 |
No other historical records.
14, Copster Close, Thurgoland, Sheffield S35 7BQ
| Today | See what it's worth now |
| 3 Nov 2025 | £295,000 |
| 8 May 1998 | £44,500 |
No other historical records.
3, Fir Tree Cottages, Roper Lane, Thurgoland, Sheffield S35 7AA
| Today | See what it's worth now |
| 31 Oct 2025 | £322,000 |
| 13 Feb 2015 | £150,000 |
6, Hall Cliffe, Thurgoland Hall Lane, Thurgoland, Sheffield S35 7AA
| Today | See what it's worth now |
| 24 Oct 2025 | £225,000 |
| 15 Dec 2017 | £198,000 |
11, Copster Close, Thurgoland, Sheffield S35 7BQ
| Today | See what it's worth now |
| 17 Oct 2025 | £290,000 |
| 23 Nov 2007 | £166,000 |
No other historical records.
17, Trinity Meadows, Thurgoland, Sheffield S35 7BZ
| Today | See what it's worth now |
| 29 Sep 2025 | £590,000 |
| 27 Jun 2022 | £585,250 |
1, Spring Terrace, Cote Lane, Thurgoland, Sheffield S35 7AE
| Today | See what it's worth now |
| 17 Sep 2025 | £165,000 |
| 14 Sep 2012 | £116,000 |
2, Knoll Close, Thurgoland, Sheffield S35 7DZ
| Today | See what it's worth now |
| 24 Jul 2025 | £670,000 |
| 26 Jun 2019 | £550,000 |
4, Ivy Bank, Halifax Road, Thurgoland, Barnsley S35 7AL
| Today | See what it's worth now |
| 23 Jul 2025 | £175,500 |
No other historical records.
10, Thurgoland Hall Fold, Thurgoland, Sheffield S35 7EA
| Today | See what it's worth now |
| 13 Jun 2025 | £426,000 |
| 14 Jul 2022 | £400,000 |
No other historical records.
8, Trinity Meadows, Thurgoland, Sheffield S35 7BZ
| Today | See what it's worth now |
| 13 Jun 2025 | £340,000 |
| 24 Aug 2018 | £220,000 |
6, Crag View, Thurgoland, Barnsley S35 7BW
| Today | See what it's worth now |
| 2 May 2025 | £405,000 |
No other historical records.
53, Old Mill Lane, Thurgoland, Sheffield S35 7EG
| Today | See what it's worth now |
| 11 Apr 2025 | £415,000 |
| 22 May 2018 | £325,000 |
No other historical records.
7, Stonecrest Rise, Thurgoland, Sheffield S35 7BP
| Today | See what it's worth now |
| 28 Mar 2025 | £325,000 |
| 12 Feb 2016 | £248,500 |
24, Springwood Rise, Thurgoland, Sheffield S35 7FH

| Today | See what it's worth now |
| 28 Mar 2025 | £569,000 |
| 29 Jul 2022 | £559,995 |
No other historical records.
31, Fairfield, Thurgoland, Sheffield S35 7FL
| Today | See what it's worth now |
| 7 Mar 2025 | £285,000 |
| 10 Mar 2023 | £299,995 |
No other historical records.
16, Trinity Meadows, Thurgoland, Sheffield S35 7BZ
| Today | See what it's worth now |
| 24 Feb 2025 | £490,000 |
| 29 Jun 2018 | £350,000 |
No other historical records.
4, Elmhirst Cottages, Smithy Hill, Thurgoland, Sheffield S35 7EB
| Today | See what it's worth now |
| 21 Feb 2025 | £145,000 |
| 27 Oct 2006 | £100,000 |
Wantacyu, Old Mill Lane, Thurgoland, Barnsley S35 7EG
| Today | See what it's worth now |
| 14 Feb 2025 | £310,000 |
No other historical records.
Birch Croft, Old Mill Lane, Thurgoland, Barnsley S35 7EG
| Today | See what it's worth now |
| 11 Feb 2025 | £430,000 |
No other historical records.
25, Hollin Moor View, Thurgoland, Sheffield S35 7EE
| Today | See what it's worth now |
| 17 Jan 2025 | £381,000 |
| 23 Mar 2017 | £238,000 |

Source Acknowledgement: © Crown copyright. England and Wales house price data is publicly available information produced by the HM Land Registry.This material was last updated on 9 July 2026. It covers the period from 1 January 1995 to 30 April 2026 and contains property transactions which have been registered during that period. Contains HM Land Registry data © Crown copyright and database right 2026. This data is licensed under the Open Government Licence v3.0.
Disclaimer: Rightmove.co.uk provides this HM Land Registry data "as is". The burden for fitness of the data relies completely with the user and is provided for informational purposes only. No warranty, express or implied, is given relating to the accuracy of content of the HM Land Registry data and Rightmove does not accept any liability for error or omission. If you have found an error with the data or need further information please contact HM Land Registry.
Permitted Use: Viewers of this Information are granted permission to access this Crown copyright material and to download it onto electronic, magnetic, optical or similar storage media provided that such activities are for private research, study or in-house use only. Any other use of the material requires the formal written permission of Land Registry which can be requested from us, and is subject to an additional licence and associated charge.
Rightmove takes no liability for your use of, or reliance on, Rightmove's Instant Valuation due to the limitations of our tracking tool listed here. Use of this tool is taken entirely at your own risk. All rights reserved.