
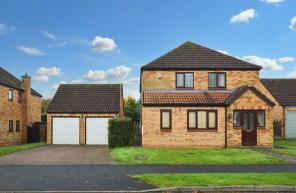
House Prices in Thurlby
House prices in Thurlby have an overall average of £358,833 over the last year.
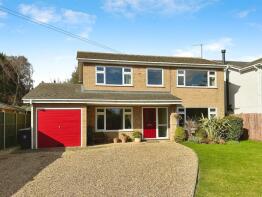
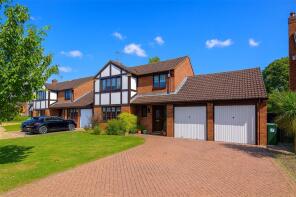
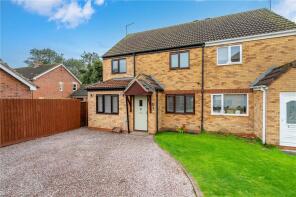
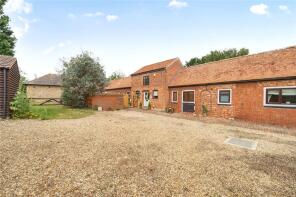
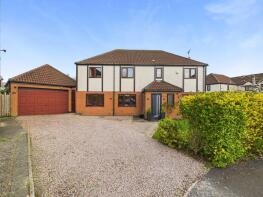
The majority of properties sold in Thurlby during the last year were detached properties, selling for an average price of £420,700. Semi-detached properties sold for an average of £208,000, with terraced properties fetching £185,000.
Overall, the historical sold prices in Thurlby over the last year were 12% down on the previous year and 13% down on the 2022 peak of £414,083.
Properties Sold
71, Chapel Lane, Bourne PE10 0EW
| Today | See what it's worth now |
| 2 Apr 2026 | £230,000 |
| 5 Apr 2019 | £180,000 |
4, The Green, Bourne PE10 0HA
| Today | See what it's worth now |
| 31 Mar 2026 | £518,000 |
| 6 Apr 2021 | £525,000 |
No other historical records.
2 Tarmay House, Priory Close, Bourne PE10 0EF
| Today | See what it's worth now |
| 27 Mar 2026 | £370,000 |
| 11 Apr 2008 | £249,950 |
No other historical records.
5 Marisa House, Bourne Road, Bourne PE10 0LQ
| Today | See what it's worth now |
| 6 Mar 2026 | £421,000 |
| 20 Jun 2005 | £265,000 |
59, Swallow Hill, Bourne PE10 0JD
| Today | See what it's worth now |
| 26 Feb 2026 | £325,000 |
| 28 Apr 2005 | £250,000 |
No other historical records.
11, Northorpe Lane, Bourne PE10 0HE
| Today | See what it's worth now |
| 26 Feb 2026 | £580,000 |
| 1 Oct 2008 | £190,916 |
44, Viking Way, Bourne PE10 0HX
| Today | See what it's worth now |
| 24 Feb 2026 | £340,000 |
| 11 Jun 2021 | £252,500 |
2, Elizabeth Way, Northorpe, Bourne PE10 0HN
| Today | See what it's worth now |
| 19 Feb 2026 | £300,000 |
| 2 Sep 2005 | £174,500 |
No other historical records.
117, Northorpe, Bourne PE10 0HZ
| Today | See what it's worth now |
| 19 Jan 2026 | £390,000 |
| 15 Apr 2016 | £260,000 |
No other historical records.
5, Ogrey Close, Bourne PE10 0QD
| Today | See what it's worth now |
| 16 Jan 2026 | £430,000 |
| 3 Jul 2019 | £330,000 |
24, Beck Way, Bourne PE10 0LE
| Today | See what it's worth now |
| 16 Jan 2026 | £245,000 |
| 17 Feb 2014 | £110,000 |
16a, The Green, Bourne PE10 0HB
| Today | See what it's worth now |
| 18 Dec 2025 | £686,000 |
| 30 Mar 2012 | £440,000 |
No other historical records.
47, Chapel Lane, Thurlby PE10 0EW
| Today | See what it's worth now |
| 27 Nov 2025 | £380,000 |
No other historical records.
59, Chapel Lane, Bourne PE10 0EW
| Today | See what it's worth now |
| 11 Nov 2025 | £175,000 |
| 11 Apr 1997 | £38,750 |
No other historical records.
7, The Causeway, Bourne PE10 0LD
| Today | See what it's worth now |
| 30 Oct 2025 | £195,000 |
| 8 Jun 2006 | £116,000 |
3 Cross Keys Cottage, Northorpe, Bourne PE10 0HH
| Today | See what it's worth now |
| 13 Oct 2025 | £300,000 |
| 5 Mar 2004 | £185,995 |
6, Priory Close, Thurlby PE10 0EF
| Today | See what it's worth now |
| 12 Sep 2025 | £500,000 |
No other historical records.
5, Viking Way, Bourne PE10 0HX
| Today | See what it's worth now |
| 5 Sep 2025 | £417,500 |
| 28 Jan 2021 | £370,000 |
No other historical records.
43, The Causeway, Bourne PE10 0LD
| Today | See what it's worth now |
| 28 Aug 2025 | £185,000 |
| 26 May 2017 | £125,000 |
22, Beck Way, Bourne PE10 0LE
| Today | See what it's worth now |
| 1 Aug 2025 | £195,000 |
| 6 Sep 2024 | £150,000 |
18, Northorpe Lane, Bourne PE10 0HE
| Today | See what it's worth now |
| 29 Jul 2025 | £353,000 |
| 19 Feb 2021 | £350,000 |
34 Ash Tree House, Swallow Hill, Bourne PE10 0JB
| Today | See what it's worth now |
| 24 Jun 2025 | £640,000 |
| 11 Apr 1997 | £146,000 |
No other historical records.
90, Northorpe, Bourne PE10 0HZ
| Today | See what it's worth now |
| 6 Jun 2025 | £275,000 |
| 6 Sep 2016 | £195,000 |
Source Acknowledgement: © Crown copyright. England and Wales house price data is publicly available information produced by the HM Land Registry.This material was last updated on 9 July 2026. It covers the period from 1 January 1995 to 30 April 2026 and contains property transactions which have been registered during that period. Contains HM Land Registry data © Crown copyright and database right 2026. This data is licensed under the Open Government Licence v3.0.
Disclaimer: Rightmove.co.uk provides this HM Land Registry data "as is". The burden for fitness of the data relies completely with the user and is provided for informational purposes only. No warranty, express or implied, is given relating to the accuracy of content of the HM Land Registry data and Rightmove does not accept any liability for error or omission. If you have found an error with the data or need further information please contact HM Land Registry.
Permitted Use: Viewers of this Information are granted permission to access this Crown copyright material and to download it onto electronic, magnetic, optical or similar storage media provided that such activities are for private research, study or in-house use only. Any other use of the material requires the formal written permission of Land Registry which can be requested from us, and is subject to an additional licence and associated charge.
Rightmove takes no liability for your use of, or reliance on, Rightmove's Instant Valuation due to the limitations of our tracking tool listed here. Use of this tool is taken entirely at your own risk. All rights reserved.