
House Prices in Thursley
House prices in Thursley have an overall average of £1,045,000 over the last year.
Overall, the historical sold prices in Thursley over the last year were 13% down on the previous year and 22% down on the 2017 peak of £1,336,357.
Properties Sold
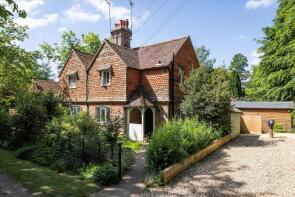
Heath Hall Lodge, French Hill, French Lane, Thursley, Godalming GU8 6NQ
| Today | See what it's worth now |
| 26 Sep 2025 | £590,000 |
No other historical records.
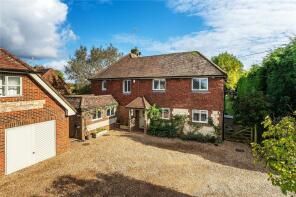
Red Lodge, Dye House Road, Thursley, Godalming GU8 6QA

| Today | See what it's worth now |
| 24 Jul 2025 | £1,500,000 |
| 19 Dec 2007 | £840,000 |
No other historical records.
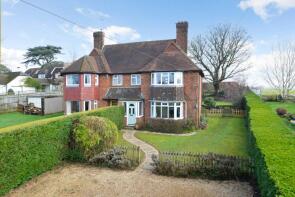
Truxford Stream Cottage, Thursley Road, Elstead, Godalming GU8 6LW
| Today | See what it's worth now |
| 26 Jun 2025 | £850,000 |
No other historical records.
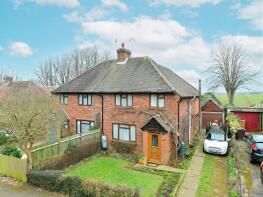
Upper Highfield Cottage, Highfield Lane, Thursley, Godalming GU8 6QJ
| Today | See what it's worth now |
| 2 May 2025 | £1,476,000 |
| 31 Jan 2020 | £1,100,000 |
Mulberry, Pitch Place, Thursley, Godalming GU8 6QW
| Today | See what it's worth now |
| 31 Mar 2025 | £2,000,000 |
No other historical records.
2, Streetfield, The Street, Thursley, Godalming GU8 6QE
| Today | See what it's worth now |
| 31 Oct 2024 | £610,000 |
| 25 Jun 2010 | £442,000 |
1, Church Cottages, The Street, Thursley, Godalming GU8 6QF
| Today | See what it's worth now |
| 9 Sep 2024 | £1,100,000 |
| 19 Mar 2021 | £950,000 |
3, Homefield Cottages, Highfield Lane, Thursley, Godalming GU8 6QH
| Today | See what it's worth now |
| 26 Jan 2024 | £495,000 |
No other historical records.
4, Silver Birch Cottages, Hyde Lane, Churt, Farnham GU10 2LP
| Today | See what it's worth now |
| 15 Dec 2023 | £490,000 |
| 2 Dec 2016 | £440,000 |
3, Thorfield, Dye House Road, Thursley, Godalming GU8 6QD

| Today | See what it's worth now |
| 23 Aug 2023 | £210,000 |
| 19 Aug 2021 | £252,000 |
No other historical records.
11, Homefield Cottages, Highfield Lane, Thursley, Godalming GU8 6QH
| Today | See what it's worth now |
| 11 Apr 2023 | £767,000 |
| 10 Jan 2020 | £360,000 |
No other historical records.
1, Thorfield, Dye House Road, Thursley, Godalming GU8 6QD
| Today | See what it's worth now |
| 19 Aug 2022 | £265,500 |
| 6 Dec 2018 | £200,000 |
Cowdray Cross, Highfield Lane, Thursley, Godalming GU8 6QJ

| Today | See what it's worth now |
| 29 Apr 2022 | £1,100,000 |
| 18 Jul 2017 | £975,000 |
Bedford Farmhouse, Bedford Lane, Thursley, Godalming GU8 6NN
| Today | See what it's worth now |
| 18 Feb 2022 | £1,950,000 |
No other historical records.
3 Shrike Cottage, The Lane, Thursley, Godalming GU8 6QB
| Today | See what it's worth now |
| 7 Jan 2022 | £399,500 |
| 5 Nov 2007 | £268,500 |
No other historical records.
Boxalls, The Street, Thursley, Godalming GU8 6QF
| Today | See what it's worth now |
| 9 Dec 2021 | £750,000 |
No other historical records.
Weymoor, Pitch Place, Thursley, Godalming GU8 6QW

| Today | See what it's worth now |
| 26 Nov 2021 | £1,301,303 |
| 29 Jan 2018 | £1,231,667 |
No other historical records.
Hill Farm, Highfield Lane, Thursley, Godalming GU8 6QQ

| Today | See what it's worth now |
| 10 Sep 2021 | £1,680,000 |
No other historical records.
Halcyon Fields, Highfield Lane, Thursley, Godalming GU8 6QQ
| Today | See what it's worth now |
| 10 Sep 2021 | £1,422,000 |
No other historical records.
1, Homefield Cottages, Highfield Lane, Thursley, Godalming GU8 6QH

| Today | See what it's worth now |
| 28 May 2021 | £452,000 |
No other historical records.
2, Silver Birch Cottages, Hyde Lane, Churt, Farnham GU10 2LP
| Today | See what it's worth now |
| 28 May 2021 | £475,000 |
| 27 Oct 1997 | £16,400 |
No other historical records.
The Old Stores, Dye House Road, Thursley, Godalming GU8 6QA
| Today | See what it's worth now |
| 15 Feb 2021 | £775,000 |
| 8 May 2013 | £642,500 |
No other historical records.
Bracken Hill, Pitch Place, Thursley, Godalming GU8 6QW

| Today | See what it's worth now |
| 10 Feb 2021 | £1,515,000 |
| 8 Apr 1998 | £500,000 |
No other historical records.
Source Acknowledgement: © Crown copyright. England and Wales house price data is publicly available information produced by the HM Land Registry.This material was last updated on 9 July 2026. It covers the period from 1 January 1995 to 30 April 2026 and contains property transactions which have been registered during that period. Contains HM Land Registry data © Crown copyright and database right 2026. This data is licensed under the Open Government Licence v3.0.
Disclaimer: Rightmove.co.uk provides this HM Land Registry data "as is". The burden for fitness of the data relies completely with the user and is provided for informational purposes only. No warranty, express or implied, is given relating to the accuracy of content of the HM Land Registry data and Rightmove does not accept any liability for error or omission. If you have found an error with the data or need further information please contact HM Land Registry.
Permitted Use: Viewers of this Information are granted permission to access this Crown copyright material and to download it onto electronic, magnetic, optical or similar storage media provided that such activities are for private research, study or in-house use only. Any other use of the material requires the formal written permission of Land Registry which can be requested from us, and is subject to an additional licence and associated charge.
Rightmove takes no liability for your use of, or reliance on, Rightmove's Instant Valuation due to the limitations of our tracking tool listed here. Use of this tool is taken entirely at your own risk. All rights reserved.