
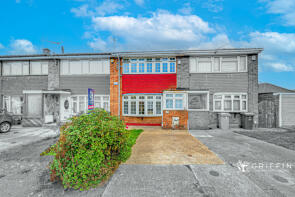
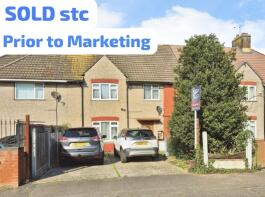
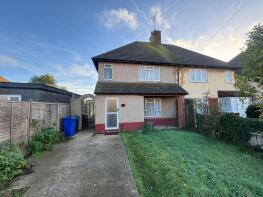
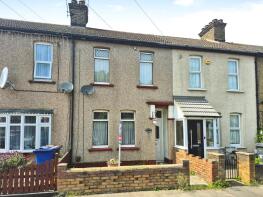
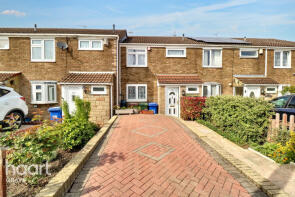
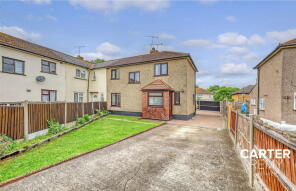
House Prices in Tilbury
House prices in Tilbury have an overall average of £309,108 over the last year.
The majority of properties sold in Tilbury during the last year were terraced properties, selling for an average price of £318,667. Semi-detached properties sold for an average of £349,643, with flats fetching £195,500.
Overall, the historical sold prices in Tilbury over the last year were similar to the previous year and 7% up on the 2023 peak of £289,254.
Properties Sold
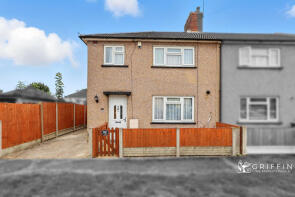
16, Monarch Close, Tilbury RM18 8EL
| Today | See what it's worth now |
| 17 Apr 2026 | £310,000 |
| 4 Nov 1999 | £42,000 |
No other historical records.
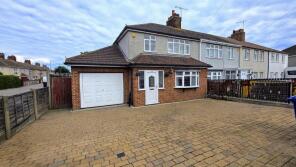
4, Bryanston Road, Tilbury RM18 8DD
| Today | See what it's worth now |
| 29 Mar 2026 | £340,000 |
| 23 Feb 2001 | £76,000 |
No other historical records.
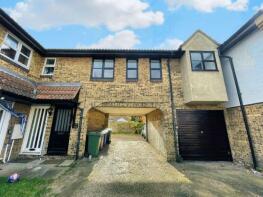
12, Feenan Highway, Tilbury RM18 8JJ
| Today | See what it's worth now |
| 11 Mar 2026 | £365,000 |
| 28 Apr 2000 | £66,995 |
No other historical records.
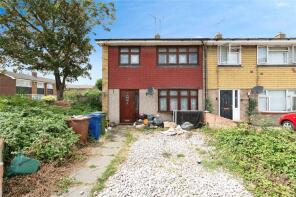
71, Burns Place, Tilbury RM18 8JQ
| Today | See what it's worth now |
| 6 Mar 2026 | £285,000 |
| 6 Oct 2006 | £145,000 |
39, Church Road, Tilbury RM18 7AJ
| Today | See what it's worth now |
| 3 Mar 2026 | £350,000 |
| 21 Mar 2016 | £225,000 |
38, Fleming Gardens, Tilbury RM18 8JR
| Today | See what it's worth now |
| 19 Feb 2026 | £312,000 |
| 14 Mar 2007 | £130,000 |
29, Fielding Avenue, Tilbury RM18 8HN

| Today | See what it's worth now |
| 17 Feb 2026 | £267,000 |
| 18 Nov 2014 | £163,500 |
43, Garner Court, Dunlop Road, Tilbury RM18 7BG
| Today | See what it's worth now |
| 13 Feb 2026 | £200,000 |
| 14 May 2021 | £157,000 |
48, Byron Gardens, Tilbury RM18 8BD
| Today | See what it's worth now |
| 13 Feb 2026 | £362,000 |
| 16 Jun 2020 | £265,000 |
No other historical records.
3, Tilbury Gardens, Tilbury RM18 7AW
| Today | See what it's worth now |
| 11 Feb 2026 | £325,000 |
No other historical records.
9, Chaucer Close, Tilbury RM18 8EG
| Today | See what it's worth now |
| 2 Feb 2026 | £317,500 |
| 18 Apr 2008 | £174,500 |
35, Gainsborough Avenue, Tilbury RM18 8LR
| Today | See what it's worth now |
| 28 Jan 2026 | £305,000 |
| 3 Jul 2015 | £195,000 |
No other historical records.
2, Auckland Close, Tilbury RM18 7PL

| Today | See what it's worth now |
| 8 Jan 2026 | £325,000 |
No other historical records.
69, The Quays, Dock Road, Tilbury RM18 7BL
| Today | See what it's worth now |
| 19 Dec 2025 | £220,000 |
| 28 Aug 2019 | £159,995 |
No other historical records.
14, Shaw Crescent, Tilbury RM18 8HY

| Today | See what it's worth now |
| 12 Dec 2025 | £206,250 |
| 11 Aug 2015 | £175,000 |
62, Gainsborough Avenue, Tilbury RM18 8LT

| Today | See what it's worth now |
| 10 Dec 2025 | £154,000 |
| 7 Feb 2005 | £157,000 |
No other historical records.
44, Spencer Walk, Tilbury RM18 8XJ
| Today | See what it's worth now |
| 9 Dec 2025 | £322,500 |
No other historical records.
15, Bermuda Road, Tilbury RM18 7DA
| Today | See what it's worth now |
| 5 Dec 2025 | £282,000 |
| 28 Sep 2001 | £67,000 |
No other historical records.
8, Swinburne Gardens, Tilbury RM18 8JP
| Today | See what it's worth now |
| 4 Dec 2025 | £351,000 |
| 10 Dec 1999 | £53,500 |
No other historical records.
100, Feenan Highway, Tilbury RM18 8JD
| Today | See what it's worth now |
| 28 Nov 2025 | £415,000 |
| 29 Aug 2007 | £199,995 |
No other historical records.
8, Dock Road, Tilbury RM18 7PT

| Today | See what it's worth now |
| 26 Nov 2025 | £385,000 |
| 27 Sep 2022 | £270,000 |
7, Arnold Place, Tilbury RM18 8HG
| Today | See what it's worth now |
| 25 Nov 2025 | £201,000 |
| 20 Jun 2003 | £82,000 |
1, Sexton Road, Tilbury RM18 7BA
| Today | See what it's worth now |
| 24 Nov 2025 | £345,000 |
| 23 May 2014 | £175,000 |
Source Acknowledgement: © Crown copyright. England and Wales house price data is publicly available information produced by the HM Land Registry.This material was last updated on 9 July 2026. It covers the period from 1 January 1995 to 30 April 2026 and contains property transactions which have been registered during that period. Contains HM Land Registry data © Crown copyright and database right 2026. This data is licensed under the Open Government Licence v3.0.
Disclaimer: Rightmove.co.uk provides this HM Land Registry data "as is". The burden for fitness of the data relies completely with the user and is provided for informational purposes only. No warranty, express or implied, is given relating to the accuracy of content of the HM Land Registry data and Rightmove does not accept any liability for error or omission. If you have found an error with the data or need further information please contact HM Land Registry.
Permitted Use: Viewers of this Information are granted permission to access this Crown copyright material and to download it onto electronic, magnetic, optical or similar storage media provided that such activities are for private research, study or in-house use only. Any other use of the material requires the formal written permission of Land Registry which can be requested from us, and is subject to an additional licence and associated charge.
Rightmove takes no liability for your use of, or reliance on, Rightmove's Instant Valuation due to the limitations of our tracking tool listed here. Use of this tool is taken entirely at your own risk. All rights reserved.