
House Prices in Tisbury
House prices in Tisbury have an overall average of £467,489 over the last year.
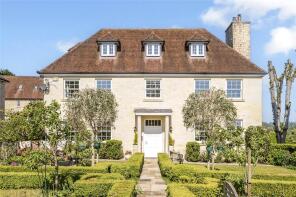
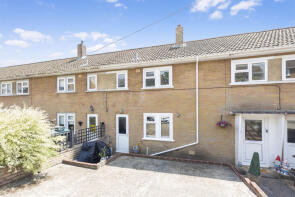
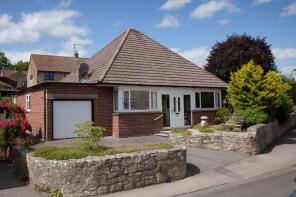
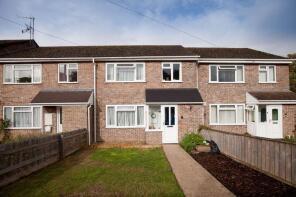
The majority of properties sold in Tisbury during the last year were detached properties, selling for an average price of £744,620. Terraced properties sold for an average of £307,111, with semi-detached properties fetching £311,800.
Overall, the historical sold prices in Tisbury over the last year were 17% up on the previous year and 14% down on the 2022 peak of £542,370.
Properties Sold
May Cottage, Church Street, Salisbury SP3 6NH
| Today | See what it's worth now |
| 18 Mar 2026 | £348,000 |
| 14 Aug 2000 | £120,000 |
39, Brook Close, Salisbury SP3 6PW
| Today | See what it's worth now |
| 10 Feb 2026 | £345,000 |
| 18 Jun 2014 | £230,000 |
1, Churchside, Church Street, Salisbury SP3 6AZ
| Today | See what it's worth now |
| 19 Dec 2025 | £173,000 |
| 18 Dec 2006 | £160,000 |
4 Down View, Fonthill Cottages, Hindon Lane, Salisbury SP3 6QD
| Today | See what it's worth now |
| 19 Dec 2025 | £352,000 |
| 31 Jul 2017 | £245,000 |
7a, Weaveland Road, Tisbury SP3 6HJ
| Today | See what it's worth now |
| 16 Dec 2025 | £230,000 |
No other historical records.
1, Alice Combes Lane, Salisbury SP3 6GZ
| Today | See what it's worth now |
| 11 Dec 2025 | £609,000 |
| 6 Jan 2015 | £370,000 |
No other historical records.
12, Morrison Avenue, Salisbury SP3 6GX

| Today | See what it's worth now |
| 1 Dec 2025 | £670,000 |
| 27 May 2016 | £460,000 |
No other historical records.
4, Alexandra Terrace, Hindon Lane, Salisbury SP3 6QA
| Today | See what it's worth now |
| 28 Nov 2025 | £400,000 |
| 2 Dec 2019 | £278,000 |
No other historical records.
16, Station Road, Salisbury SP3 6JR
| Today | See what it's worth now |
| 27 Nov 2025 | £252,000 |
| 13 Apr 2021 | £189,000 |
1, Bridge House, Station Road, Salisbury SP3 6JT

| Today | See what it's worth now |
| 27 Nov 2025 | £495,000 |
| 28 Mar 2006 | £215,000 |
No other historical records.
49, Newtown, Tisbury SP3 6NY
| Today | See what it's worth now |
| 17 Nov 2025 | £330,000 |
No other historical records.
73, Queens Road, Salisbury SP3 6JW
| Today | See what it's worth now |
| 7 Nov 2025 | £290,000 |
| 7 Dec 2012 | £192,000 |
3, Weaveland Road, Salisbury SP3 6HJ
| Today | See what it's worth now |
| 4 Nov 2025 | £265,000 |
| 10 Aug 2022 | £245,000 |
The Old Vicarage, Park Road, Salisbury SP3 6LF
| Today | See what it's worth now |
| 4 Nov 2025 | £1,200,000 |
| 23 Aug 2013 | £740,000 |
No other historical records.
21, Lady Down View, Salisbury SP3 6LL
| Today | See what it's worth now |
| 30 Oct 2025 | £1,595,000 |
| 22 Oct 2018 | £1,230,000 |
No other historical records.
20, Queens Road, Salisbury SP3 6JN
| Today | See what it's worth now |
| 24 Oct 2025 | £255,000 |
| 7 Oct 2020 | £215,000 |
58, Church Street, Salisbury SP3 6NH
| Today | See what it's worth now |
| 13 Oct 2025 | £500,201 |
| 13 Jul 2022 | £450,000 |
30, St Johns Close, Tisbury SP3 6PN
| Today | See what it's worth now |
| 10 Oct 2025 | £295,000 |
No other historical records.
2, Knapp Hollow, Salisbury SP3 6DQ
| Today | See what it's worth now |
| 8 Oct 2025 | £717,000 |
| 29 May 2013 | £480,000 |
No other historical records.
9, Paradise Meadow, Salisbury SP3 6DG
| Today | See what it's worth now |
| 6 Oct 2025 | £335,000 |
| 16 Apr 2021 | £305,000 |
2, Churchside, Church Street, Salisbury SP3 6AZ

| Today | See what it's worth now |
| 5 Sep 2025 | £185,000 |
| 7 Apr 2015 | £159,000 |
2 Nadder Barn, The Old Farmyard, Court Street, Salisbury SP3 6NZ
| Today | See what it's worth now |
| 1 Sep 2025 | £895,000 |
| 31 Aug 2021 | £725,000 |
14, St Johns Close, Salisbury SP3 6PN
| Today | See what it's worth now |
| 29 Aug 2025 | £240,000 |
| 15 Mar 2004 | £126,000 |
Source Acknowledgement: © Crown copyright. England and Wales house price data is publicly available information produced by the HM Land Registry.This material was last updated on 9 July 2026. It covers the period from 1 January 1995 to 30 April 2026 and contains property transactions which have been registered during that period. Contains HM Land Registry data © Crown copyright and database right 2026. This data is licensed under the Open Government Licence v3.0.
Disclaimer: Rightmove.co.uk provides this HM Land Registry data "as is". The burden for fitness of the data relies completely with the user and is provided for informational purposes only. No warranty, express or implied, is given relating to the accuracy of content of the HM Land Registry data and Rightmove does not accept any liability for error or omission. If you have found an error with the data or need further information please contact HM Land Registry.
Permitted Use: Viewers of this Information are granted permission to access this Crown copyright material and to download it onto electronic, magnetic, optical or similar storage media provided that such activities are for private research, study or in-house use only. Any other use of the material requires the formal written permission of Land Registry which can be requested from us, and is subject to an additional licence and associated charge.
Rightmove takes no liability for your use of, or reliance on, Rightmove's Instant Valuation due to the limitations of our tracking tool listed here. Use of this tool is taken entirely at your own risk. All rights reserved.