
House Prices in Tolworth
House prices in Tolworth have an overall average of £651,603 over the last year.
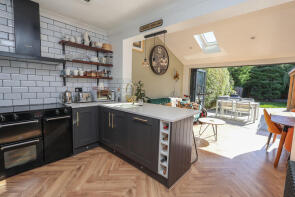
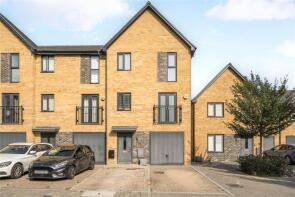
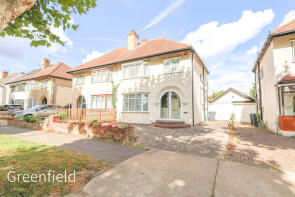
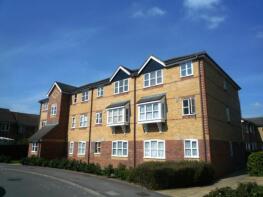
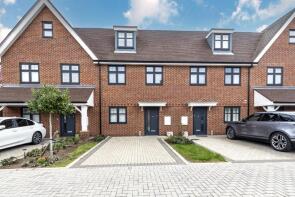
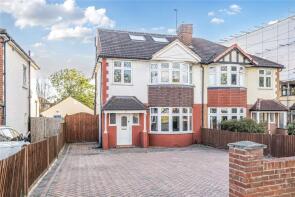
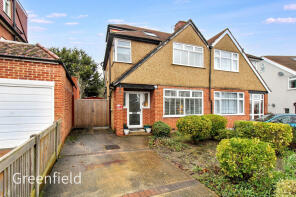
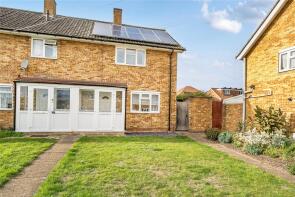
The majority of properties sold in Tolworth during the last year were semi-detached properties, selling for an average price of £751,573. Terraced properties sold for an average of £604,846, with flats fetching £341,259.
Overall, the historical sold prices in Tolworth over the last year were 11% up on the previous year and 13% up on the 2023 peak of £577,949.
Properties Sold
54, Kingsmead Avenue, Surbiton KT6 7PP
| Today | See what it's worth now |
| 27 Apr 2026 | £664,500 |
| 3 Jul 1998 | £110,000 |
No other historical records.
1, Firdene, Surbiton KT5 9QQ
| Today | See what it's worth now |
| 17 Apr 2026 | £541,000 |
| 18 May 2021 | £466,000 |
5, Worthington Road, Surbiton KT6 7RU
| Today | See what it's worth now |
| 13 Apr 2026 | £816,000 |
| 24 Sep 2010 | £490,000 |
16, Endway, Surbiton KT5 9BT
| Today | See what it's worth now |
| 8 Apr 2026 | £630,000 |
No other historical records.
35, Fullers Way North, Surbiton KT6 7LQ
| Today | See what it's worth now |
| 1 Apr 2026 | £572,000 |
| 14 Aug 2015 | £422,500 |
23, Worthington Road, Surbiton KT6 7RU

| Today | See what it's worth now |
| 31 Mar 2026 | £820,000 |
| 15 Jul 1999 | £166,000 |
No other historical records.
8, Tala Close, Surbiton KT6 7EY
| Today | See what it's worth now |
| 26 Mar 2026 | £692,000 |
| 9 May 2018 | £575,000 |
No other historical records.
76, Elgar Avenue, Surbiton KT5 9JN
| Today | See what it's worth now |
| 25 Mar 2026 | £795,000 |
| 27 Oct 1995 | £137,000 |
No other historical records.
43, Donald Woods Gardens, Surbiton KT5 9NP
| Today | See what it's worth now |
| 23 Mar 2026 | £235,000 |
| 7 Mar 2016 | £255,000 |
27, Lyndhurst Avenue, Surbiton KT5 9LN

| Today | See what it's worth now |
| 23 Mar 2026 | £460,000 |
| 21 Dec 2010 | £370,000 |
No other historical records.
24, Vale Road South, Surbiton KT6 5AQ
| Today | See what it's worth now |
| 23 Mar 2026 | £680,000 |
| 25 Sep 2020 | £600,000 |
No other historical records.
78, Warren Drive South, Surbiton KT5 9QE
| Today | See what it's worth now |
| 13 Mar 2026 | £715,000 |
| 16 Sep 2002 | £248,950 |
No other historical records.
10, Fairmead, Surbiton KT5 9BA

| Today | See what it's worth now |
| 13 Mar 2026 | £650,000 |
| 7 Jun 2007 | £335,000 |
No other historical records.
55, Collingwood Avenue, Surbiton KT5 9PU
| Today | See what it's worth now |
| 11 Mar 2026 | £620,000 |
| 22 May 2015 | £490,000 |
No other historical records.
58, Hazel Bank, Surbiton KT5 9RH

| Today | See what it's worth now |
| 11 Mar 2026 | £470,000 |
| 29 Jul 1999 | £103,000 |
No other historical records.
40, Kent Way, Tolworth KT6 7SU
| Today | See what it's worth now |
| 5 Mar 2026 | £445,000 |
No other historical records.
50, Moresby Avenue, Surbiton KT5 9DS
| Today | See what it's worth now |
| 4 Mar 2026 | £975,000 |
| 22 Oct 2007 | £370,000 |
No other historical records.
18, Vincent Avenue, Surbiton KT5 9RE
| Today | See what it's worth now |
| 27 Feb 2026 | £500,000 |
| 29 Aug 2019 | £330,000 |
44, Hazel Bank, Surbiton KT5 9RH
| Today | See what it's worth now |
| 27 Feb 2026 | £501,000 |
| 9 Feb 2018 | £385,000 |
No other historical records.
100, Beaconsfield Road, Surbiton KT5 9AP
| Today | See what it's worth now |
| 25 Feb 2026 | £848,000 |
| 7 Oct 2013 | £499,950 |
53, Vincent Avenue, Tolworth KT5 9RD
| Today | See what it's worth now |
| 23 Feb 2026 | £435,000 |
No other historical records.
60, Hamilton Avenue, Tolworth KT6 7PN
| Today | See what it's worth now |
| 20 Feb 2026 | £540,000 |
No other historical records.
21, Ladywood Road, Surbiton KT6 7PB
| Today | See what it's worth now |
| 20 Feb 2026 | £715,000 |
| 3 Apr 2018 | £485,000 |
No other historical records.
Source Acknowledgement: © Crown copyright. England and Wales house price data is publicly available information produced by the HM Land Registry.This material was last updated on 9 July 2026. It covers the period from 1 January 1995 to 30 April 2026 and contains property transactions which have been registered during that period. Contains HM Land Registry data © Crown copyright and database right 2026. This data is licensed under the Open Government Licence v3.0.
Disclaimer: Rightmove.co.uk provides this HM Land Registry data "as is". The burden for fitness of the data relies completely with the user and is provided for informational purposes only. No warranty, express or implied, is given relating to the accuracy of content of the HM Land Registry data and Rightmove does not accept any liability for error or omission. If you have found an error with the data or need further information please contact HM Land Registry.
Permitted Use: Viewers of this Information are granted permission to access this Crown copyright material and to download it onto electronic, magnetic, optical or similar storage media provided that such activities are for private research, study or in-house use only. Any other use of the material requires the formal written permission of Land Registry which can be requested from us, and is subject to an additional licence and associated charge.
Rightmove takes no liability for your use of, or reliance on, Rightmove's Instant Valuation due to the limitations of our tracking tool listed here. Use of this tool is taken entirely at your own risk. All rights reserved.