
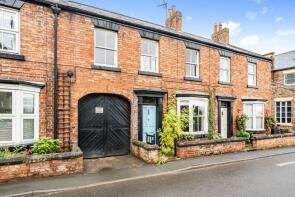
House Prices in Topcliffe
House prices in Topcliffe have an overall average of £345,312 over the last year.
The majority of properties sold in Topcliffe during the last year were terraced properties, selling for an average price of £368,125. Detached properties sold for an average of £407,500, with semi-detached properties fetching £255,000.
Overall, the historical sold prices in Topcliffe over the last year were 35% up on the previous year and 21% down on the 2021 peak of £435,119.
Properties Sold
4, Manor Close, Thirsk YO7 3RH
| Today | See what it's worth now |
| 20 Mar 2026 | £255,000 |
| 17 Feb 2014 | £160,000 |
Bank Top House, Church Street, Thirsk YO7 3PA
| Today | See what it's worth now |
| 17 Mar 2026 | £425,000 |
| 26 Mar 2021 | £340,000 |
No other historical records.
8, East Lea, Thirsk YO7 3RS
| Today | See what it's worth now |
| 24 Oct 2025 | £225,000 |
| 2 May 2017 | £172,000 |
7, Riverside Apartments, Catton Road, Thirsk YO7 3RZ
| Today | See what it's worth now |
| 10 Oct 2025 | £220,000 |
| 12 Sep 2022 | £156,000 |
Woodstock, Long Street, Thirsk YO7 3RW
| Today | See what it's worth now |
| 10 Sep 2025 | £390,000 |
| 26 Nov 2012 | £245,000 |
8, Winn Lane, Topcliffe YO7 3RP

| Today | See what it's worth now |
| 6 Aug 2025 | £175,000 |
No other historical records.
2, Church Street, Thirsk YO7 3PA
| Today | See what it's worth now |
| 5 Aug 2025 | £187,500 |
| 16 Aug 2019 | £175,000 |
The Mount, Church Street, Thirsk YO7 3PA
| Today | See what it's worth now |
| 21 Jul 2025 | £885,000 |
| 29 Jun 2021 | £750,000 |
No other historical records.
3, East Lea, Thirsk YO7 3RS
| Today | See what it's worth now |
| 9 May 2025 | £248,000 |
| 5 Apr 2007 | £205,000 |
17, Church Street, Thirsk YO7 3PA
| Today | See what it's worth now |
| 28 Mar 2025 | £200,000 |
| 14 Sep 2017 | £145,000 |
16, East Lea, Thirsk YO7 3RR
| Today | See what it's worth now |
| 24 Mar 2025 | £230,000 |
| 22 Jul 2022 | £225,000 |
Hambleton, Station Road, Topcliffe YO7 3SQ
| Today | See what it's worth now |
| 28 Feb 2025 | £312,000 |
| 3 Sep 2021 | £297,000 |
Carlton Cottage, Deans Square, Thirsk YO7 3RT
| Today | See what it's worth now |
| 14 Feb 2025 | £240,000 |
| 18 Feb 2022 | £167,500 |
10, Riverside Apartments, Catton Road, Topcliffe YO7 3RZ

| Today | See what it's worth now |
| 15 Nov 2024 | £215,000 |
No other historical records.
81, Long Street, Thirsk YO7 3RL
| Today | See what it's worth now |
| 29 Oct 2024 | £320,500 |
| 13 Feb 2024 | £195,000 |
No other historical records.
10, Manor Close, Thirsk YO7 3RH
| Today | See what it's worth now |
| 20 Sep 2024 | £290,000 |
| 19 Jan 2018 | £222,000 |
42, Front Street, Thirsk YO7 3RJ
| Today | See what it's worth now |
| 12 Sep 2024 | £252,000 |
| 4 Dec 2003 | £125,000 |
The Pinfold, Front Street, Thirsk YO7 3RJ

| Today | See what it's worth now |
| 25 Jun 2024 | £249,950 |
| 20 Dec 2013 | £185,000 |
Ashton House, Deans Square, Thirsk YO7 3RT

| Today | See what it's worth now |
| 28 Mar 2024 | £285,000 |
| 8 Mar 2018 | £160,000 |
No other historical records.
Mill Rise, Front Street, Thirsk YO7 3RU

| Today | See what it's worth now |
| 7 Mar 2024 | £550,000 |
| 25 Jan 2018 | £380,000 |
Halfway House, Topcliffe Road To District Boundary, Thirsk YO7 3HN

| Today | See what it's worth now |
| 12 May 2023 | £270,000 |
| 27 Aug 2004 | £190,000 |
5, Riverside Apartments, Catton Road, Thirsk YO7 3RZ
| Today | See what it's worth now |
| 12 Sep 2022 | £130,000 |
| 17 Sep 2004 | £137,000 |
8, Riverside Apartments, Catton Road, Thirsk YO7 3RZ
| Today | See what it's worth now |
| 10 Aug 2022 | £80,000 |
| 17 Aug 2001 | £67,000 |
Source Acknowledgement: © Crown copyright. England and Wales house price data is publicly available information produced by the HM Land Registry.This material was last updated on 9 July 2026. It covers the period from 1 January 1995 to 30 April 2026 and contains property transactions which have been registered during that period. Contains HM Land Registry data © Crown copyright and database right 2026. This data is licensed under the Open Government Licence v3.0.
Disclaimer: Rightmove.co.uk provides this HM Land Registry data "as is". The burden for fitness of the data relies completely with the user and is provided for informational purposes only. No warranty, express or implied, is given relating to the accuracy of content of the HM Land Registry data and Rightmove does not accept any liability for error or omission. If you have found an error with the data or need further information please contact HM Land Registry.
Permitted Use: Viewers of this Information are granted permission to access this Crown copyright material and to download it onto electronic, magnetic, optical or similar storage media provided that such activities are for private research, study or in-house use only. Any other use of the material requires the formal written permission of Land Registry which can be requested from us, and is subject to an additional licence and associated charge.
Rightmove takes no liability for your use of, or reliance on, Rightmove's Instant Valuation due to the limitations of our tracking tool listed here. Use of this tool is taken entirely at your own risk. All rights reserved.