
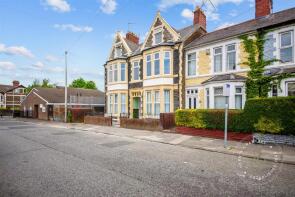
House Prices in Tremorfa
House prices in Tremorfa have an overall average of £672,773 over the last year.
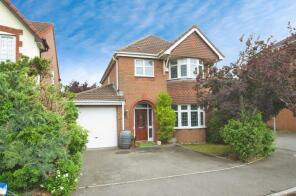
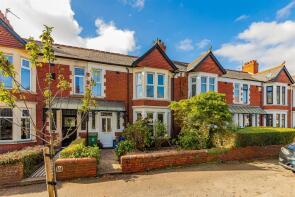
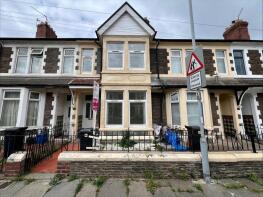
The majority of properties sold in Tremorfa during the last year were terraced properties, selling for an average price of £239,661. Flats sold for an average of £134,643, with semi-detached properties fetching £4,171,600.
Overall, the historical sold prices in Tremorfa over the last year were 218% up on the previous year and 230% up on the 2022 peak of £204,091.
Properties Sold
18, Wilson Street, Splott, Cardiff CF24 2NZ
| Today | See what it's worth now |
| 1 Apr 2026 | £250,000 |
| 3 Aug 2018 | £190,000 |
27, Swinton Street, Splott, Cardiff CF24 2NU
| Today | See what it's worth now |
| 31 Mar 2026 | £245,000 |
| 9 Dec 2016 | £169,950 |
192, Railway Street, Splott, Cardiff CF24 2NH
| Today | See what it's worth now |
| 27 Mar 2026 | £220,000 |
| 16 Feb 2023 | £210,000 |
45, Theodora Street, Adamsdown, Cardiff CF24 1PB
| Today | See what it's worth now |
| 10 Mar 2026 | £248,000 |
| 14 Feb 2020 | £165,000 |
No other historical records.
6, Hart Place, Splott, Cardiff CF24 2TP
| Today | See what it's worth now |
| 9 Mar 2026 | £372,000 |
| 5 Dec 2002 | £147,950 |
No other historical records.
3, Moorland Road, Splott, Cardiff CF24 2LF
| Today | See what it's worth now |
| 6 Mar 2026 | £225,500 |
| 12 Jun 1998 | £30,000 |
No other historical records.
27, Southminster Road, Roath, Cardiff CF23 5AT
| Today | See what it's worth now |
| 27 Feb 2026 | £475,000 |
| 8 Nov 1996 | £87,000 |
No other historical records.
92, Moorland Road, Splott, Cardiff CF24 2LP
| Today | See what it's worth now |
| 19 Feb 2026 | £247,000 |
| 19 Feb 2016 | £148,750 |
3, Florence Street, Splott, Cardiff CF24 2PA
| Today | See what it's worth now |
| 19 Feb 2026 | £239,000 |
| 16 Aug 1999 | £53,000 |
No other historical records.
155, Habershon Street, Splott, Cardiff CF24 2LA
| Today | See what it's worth now |
| 11 Feb 2026 | £260,000 |
| 23 Aug 2019 | £200,000 |
102, Horwood Close, Splott, Cardiff CF24 2LY
| Today | See what it's worth now |
| 19 Jan 2026 | £165,000 |
| 10 Dec 2021 | £144,000 |
22, Mona Place, Splott, Cardiff CF24 2TG
| Today | See what it's worth now |
| 16 Jan 2026 | £168,000 |
| 1 Sep 2006 | £75,000 |
No other historical records.
71a, Moorland Road, Splott, Cardiff CF24 2LG
| Today | See what it's worth now |
| 9 Jan 2026 | £196,000 |
| 20 Apr 2018 | £148,000 |
125, Beaufort Square, Splott, Cardiff CF24 2TX
| Today | See what it's worth now |
| 19 Dec 2025 | £140,000 |
| 2 Feb 2007 | £117,400 |
20, Dalmuir Road, Splott, Cardiff CF24 2PW
| Today | See what it's worth now |
| 15 Dec 2025 | £225,000 |
| 18 Feb 2005 | £120,000 |
No other historical records.
1, Dalmuir Road, Splott, Cardiff CF24 2PW

| Today | See what it's worth now |
| 8 Dec 2025 | £200,000 |
| 8 Dec 2025 | £20,000,000 |
35, Meredith Road, Splott, Cardiff CF24 2SW
| Today | See what it's worth now |
| 4 Dec 2025 | £228,000 |
| 8 Jul 2024 | £210,000 |
16, Madoc Road, Splott, Cardiff CF24 2TA
| Today | See what it's worth now |
| 28 Nov 2025 | £245,000 |
| 26 Feb 2009 | £110,000 |
154, Tweedsmuir Road, Splott, Cardiff CF24 2RF
| Today | See what it's worth now |
| 26 Nov 2025 | £207,000 |
| 14 Jun 2019 | £145,000 |
11, Fort Street, Roath, Cardiff CF24 1QQ
| Today | See what it's worth now |
| 14 Nov 2025 | £205,000 |
| 15 Jan 2010 | £137,000 |
55, Richards Terrace, Roath, Cardiff CF24 1RW
| Today | See what it's worth now |
| 14 Nov 2025 | £370,000 |
| 9 Aug 2019 | £210,000 |
No other historical records.
53, Clydesmuir Road, Splott, Cardiff CF24 2PX
| Today | See what it's worth now |
| 6 Nov 2025 | £220,000 |
| 2 Nov 2016 | £185,000 |
74, Madoc Road, Splott, Cardiff CF24 2TB
| Today | See what it's worth now |
| 6 Nov 2025 | £205,000 |
| 28 Feb 2007 | £120,000 |
Source Acknowledgement: © Crown copyright. England and Wales house price data is publicly available information produced by the HM Land Registry.This material was last updated on 9 July 2026. It covers the period from 1 January 1995 to 30 April 2026 and contains property transactions which have been registered during that period. Contains HM Land Registry data © Crown copyright and database right 2026. This data is licensed under the Open Government Licence v3.0.
Disclaimer: Rightmove.co.uk provides this HM Land Registry data "as is". The burden for fitness of the data relies completely with the user and is provided for informational purposes only. No warranty, express or implied, is given relating to the accuracy of content of the HM Land Registry data and Rightmove does not accept any liability for error or omission. If you have found an error with the data or need further information please contact HM Land Registry.
Permitted Use: Viewers of this Information are granted permission to access this Crown copyright material and to download it onto electronic, magnetic, optical or similar storage media provided that such activities are for private research, study or in-house use only. Any other use of the material requires the formal written permission of Land Registry which can be requested from us, and is subject to an additional licence and associated charge.
Rightmove takes no liability for your use of, or reliance on, Rightmove's Instant Valuation due to the limitations of our tracking tool listed here. Use of this tool is taken entirely at your own risk. All rights reserved.