
House Prices in Trenant Park
House prices in Trenant Park have an overall average of £295,824 over the last year.
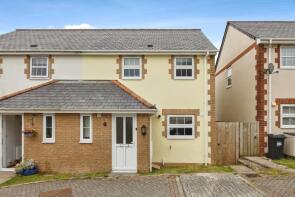
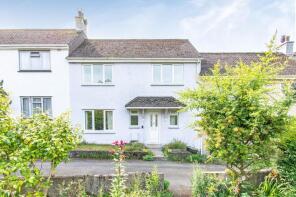
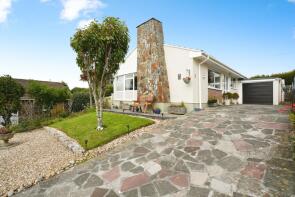
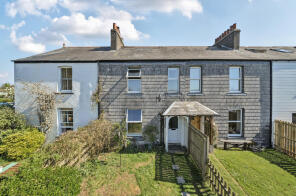
The majority of properties sold in Trenant Park during the last year were detached properties, selling for an average price of £371,471. Semi-detached properties sold for an average of £278,300, with terraced properties fetching £207,500.
Overall, the historical sold prices in Trenant Park over the last year were 5% up on the previous year and 8% up on the 2023 peak of £273,077.
Properties Sold
4, Barnfield Terrace, Station Road, Liskeard PL14 4DT

| Today | See what it's worth now |
| 27 Mar 2026 | £320,000 |
| 12 Aug 2005 | £160,000 |
5, Oak Drive, Liskeard PL14 4EU
| Today | See what it's worth now |
| 27 Mar 2026 | £325,000 |
| 4 Nov 2014 | £247,000 |
Avalwedhen, Trewidland PL14 4SN
| Today | See what it's worth now |
| 26 Mar 2026 | £620,000 |
| 7 Feb 2013 | £305,000 |
No other historical records.
34, Pavlova Court, Liskeard PL14 4NY
| Today | See what it's worth now |
| 9 Mar 2026 | £133,000 |
| 4 Nov 2013 | £102,000 |
4, The Green, B3254 Between Polvean Cross And St Cubys Church, Liskeard PL14 4PW
| Today | See what it's worth now |
| 2 Mar 2026 | £385,000 |
| 20 Nov 1998 | £69,000 |
No other historical records.
Penhole Cottage, East Taphouse PL14 4NP
| Today | See what it's worth now |
| 24 Feb 2026 | £415,000 |
| 21 Mar 2014 | £247,500 |
Farthings, Road From The B3254 Junction West Of Penhale To Gellis Rise, Trewidland, Liskeard PL14 4SS

| Today | See what it's worth now |
| 24 Feb 2026 | £430,000 |
| 10 Dec 2013 | £285,000 |
West Benoak Barn, St. Keyne, St Keyne PL14 4RR
| Today | See what it's worth now |
| 19 Feb 2026 | £330,000 |
No other historical records.
9, Penhale Close, Liskeard PL14 4FH
| Today | See what it's worth now |
| 17 Feb 2026 | £132,500 |
| 26 Oct 2018 | £94,950 |
No other historical records.
The Meadows, Station Road, Liskeard PL14 4BY
| Today | See what it's worth now |
| 20 Jan 2026 | £340,000 |
No other historical records.
Lyndhurst, Road From The Sunday School To Junction West Of Lunghwa, Liskeard PL14 4LZ
| Today | See what it's worth now |
| 7 Jan 2026 | £342,500 |
| 29 Jun 2023 | £365,000 |
48, Trevillis Park, Liskeard PL14 4EG

| Today | See what it's worth now |
| 19 Dec 2025 | £260,000 |
| 20 Oct 2000 | £69,000 |
No other historical records.
9, Farmers Close, Liskeard PL14 4SY
| Today | See what it's worth now |
| 19 Dec 2025 | £200,000 |
| 23 Sep 2021 | £186,000 |
5, Pras Gwartha, Duloe PL14 4FQ
| Today | See what it's worth now |
| 18 Dec 2025 | £225,000 |
No other historical records.
24, Allen Vale, Liskeard PL14 4HL

| Today | See what it's worth now |
| 18 Dec 2025 | £240,000 |
| 18 Mar 2011 | £155,000 |
No other historical records.
3, Limes Lane, Liskeard PL14 4HP
| Today | See what it's worth now |
| 18 Dec 2025 | £180,500 |
| 3 Dec 2001 | £29,000 |
No other historical records.
13, Valley View, Liskeard PL14 4QH
| Today | See what it's worth now |
| 15 Dec 2025 | £320,000 |
| 1 Mar 2024 | £285,000 |
No other historical records.
8, Manley Terrace, Station Road, Liskeard PL14 4DW
| Today | See what it's worth now |
| 12 Dec 2025 | £500,000 |
No other historical records.
11, Lodge Hill, Liskeard PL14 4JP
| Today | See what it's worth now |
| 12 Dec 2025 | £190,000 |
| 23 Dec 2004 | £157,500 |
11, Penhale Close, Liskeard PL14 4FH
| Today | See what it's worth now |
| 18 Nov 2025 | £177,500 |
| 1 Mar 2019 | £145,000 |
No other historical records.
48, Highwood Park, Liskeard PL14 6LJ
| Today | See what it's worth now |
| 10 Nov 2025 | £265,000 |
| 16 Mar 2012 | £144,000 |
Maple House, Station Road, Liskeard PL14 4BY
| Today | See what it's worth now |
| 7 Nov 2025 | £425,000 |
| 13 Mar 2018 | £239,500 |
8, Hazelmead, Liskeard PL14 4PY
| Today | See what it's worth now |
| 24 Oct 2025 | £252,500 |
| 6 Aug 2021 | £256,500 |

Source Acknowledgement: © Crown copyright. England and Wales house price data is publicly available information produced by the HM Land Registry.This material was last updated on 9 July 2026. It covers the period from 1 January 1995 to 30 April 2026 and contains property transactions which have been registered during that period. Contains HM Land Registry data © Crown copyright and database right 2026. This data is licensed under the Open Government Licence v3.0.
Disclaimer: Rightmove.co.uk provides this HM Land Registry data "as is". The burden for fitness of the data relies completely with the user and is provided for informational purposes only. No warranty, express or implied, is given relating to the accuracy of content of the HM Land Registry data and Rightmove does not accept any liability for error or omission. If you have found an error with the data or need further information please contact HM Land Registry.
Permitted Use: Viewers of this Information are granted permission to access this Crown copyright material and to download it onto electronic, magnetic, optical or similar storage media provided that such activities are for private research, study or in-house use only. Any other use of the material requires the formal written permission of Land Registry which can be requested from us, and is subject to an additional licence and associated charge.
Rightmove takes no liability for your use of, or reliance on, Rightmove's Instant Valuation due to the limitations of our tracking tool listed here. Use of this tool is taken entirely at your own risk. All rights reserved.